Distance Algorithm Visualization (DAV) Tool
This overview walks you through the main purpose of DAV, how it relates to Lorentzian distance measurements, and why we offer it as a unique educational resource for our community.
Introduction
The Distance Algorithm Visualization (DAV) tool was first introduced by Justin Dehorty in his YouTube video, "Lorentzian Classification: Machine Learning Driven TradingView Indicator". Around the 3:42 timestamp, Justin used DAV to illustrate how Lorentzian distance measurement differs from Euclidian distance measurement.
Over time, many users asked about this tool. We initially withheld it because it isn’t strictly for trading analysis, but rather an educational companion for anyone curious about visualizing distance measurements in three-dimensional space. Now, we provide DAV as a special perk for our Discord Server Boosters—an interactive way to explore Lorentzian concepts.
Note: The following documentation isn’t a complete reference but a helpful primer to get you started exploring DAV’s core features.
The Main Screen
DAV’s user interface (UI) is built with three.js for 3D rendering. The interface has two key parts:
- UI Controls at the top
- Rendering Canvas below the controls
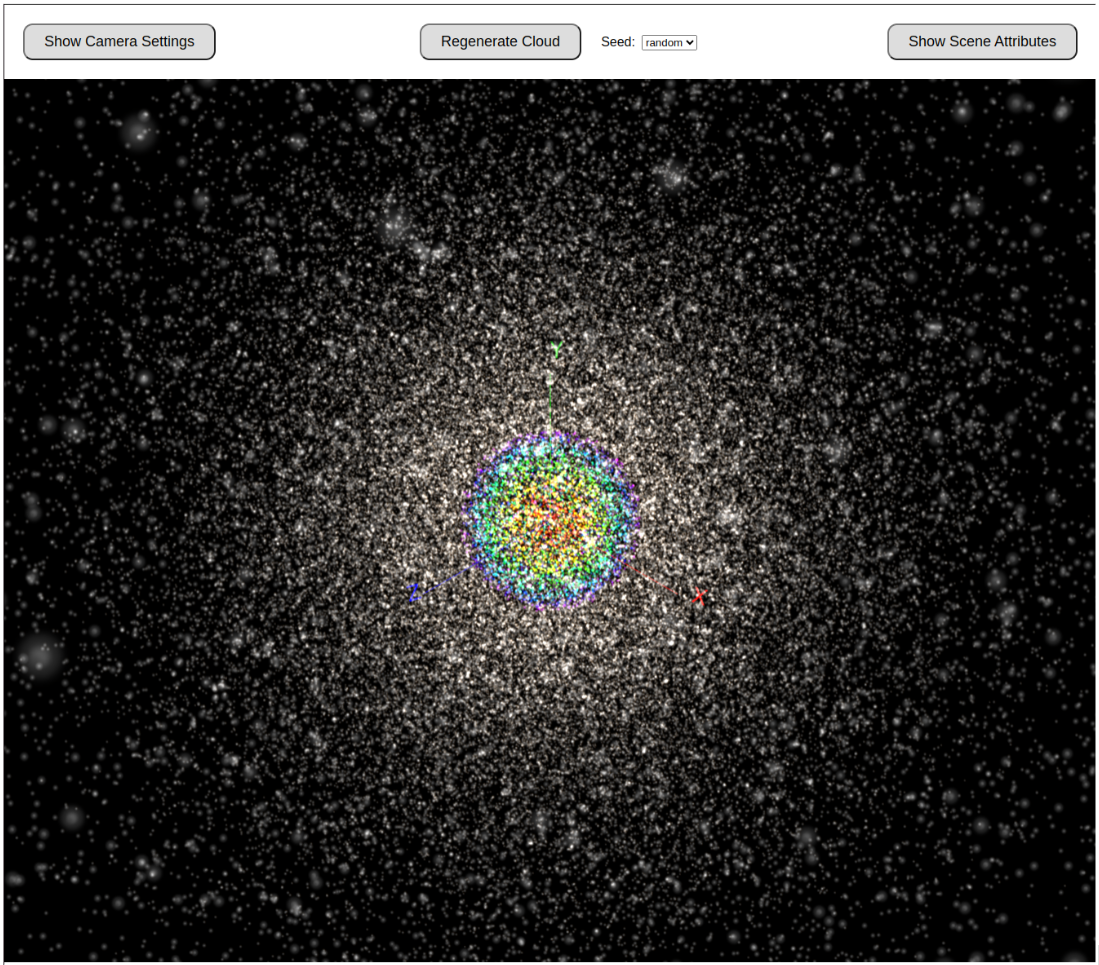 |
|---|
| Fig 1: DAV’s main screen, showing top UI controls and a 3D canvas. |
SpaceTime vs. PriceTime
A key philosophy behind DAV’s visualization is that most people have an easier time grasping a 3D representation of SpaceTime than they do abstract mathematical formulas. By visualizing points in 3D space—complete with axes, zoom, and rotation—it becomes more intuitive to understand how Lorentzian distance can be superior to Euclidian distance in certain contexts.
When we translate this concept to PriceTime, each point in DAV’s cloud is analogous to a historical data point in a financial time series. Lorentzian distance measurements can pick different neighbors than Euclidian would, potentially leading to different (and often more relevant) insights in a trading context.
Summary
In essence, DAV is an educational tool designed to:
- Demonstrate how different distance formulas (Lorentzian, Euclidian, Hyperbolic, etc.) yield different nearest neighbors.
- Visualize these differences in a clear 3D environment.
- Bridge the conceptual gap between “SpaceTime” and “PriceTime,” highlighting why Lorentzian metrics can be advantageous in finance.
The sections that follow (in Core Concepts) dive deeper into the specific UI panels (Scene Attributes, Camera Settings) and how to manipulate the point cloud to better understand nearest neighbors, axis labeling, and more.