Understanding Core Concepts
Future Pivots (FP) stands apart from many conventional oscillators by focusing on when markets might pivot rather than offering a price-direction forecast. Below, we explore the technical pillars that make FP such a valuable timing indicator.
Timing Over Direction
Why "Timing" Matters
Markets often blindside traders not merely by moving up or down, but by the speed and unexpectedness of that move. FP excels at uncovering these explosive pockets of volatility—allowing you to plan ahead and choose entry/exit strategies or complementary indicators to gauge the eventual direction.
Compatibility with Other Systems
- Lorentzian Classification: While Lorentzian compares market points across warped space, FP flags the warping itself. Used together, they offer a potent combo of where (Lorentzian) and when (Future Pivots).
- WaveTrend 3D: FP can highlight pivot timing that often correlates with WaveTrend 3D’s dominant frequency crossovers.
Price-Time Warping
Concept Clarification
Price-time warping describes periods of abnormally high/low volatility or momentum, during which standard linear indicators may falter. FP’s internal algorithms detect these warping phases, prompting traders to be on high alert for potential breakouts or reversals.
 |
|---|
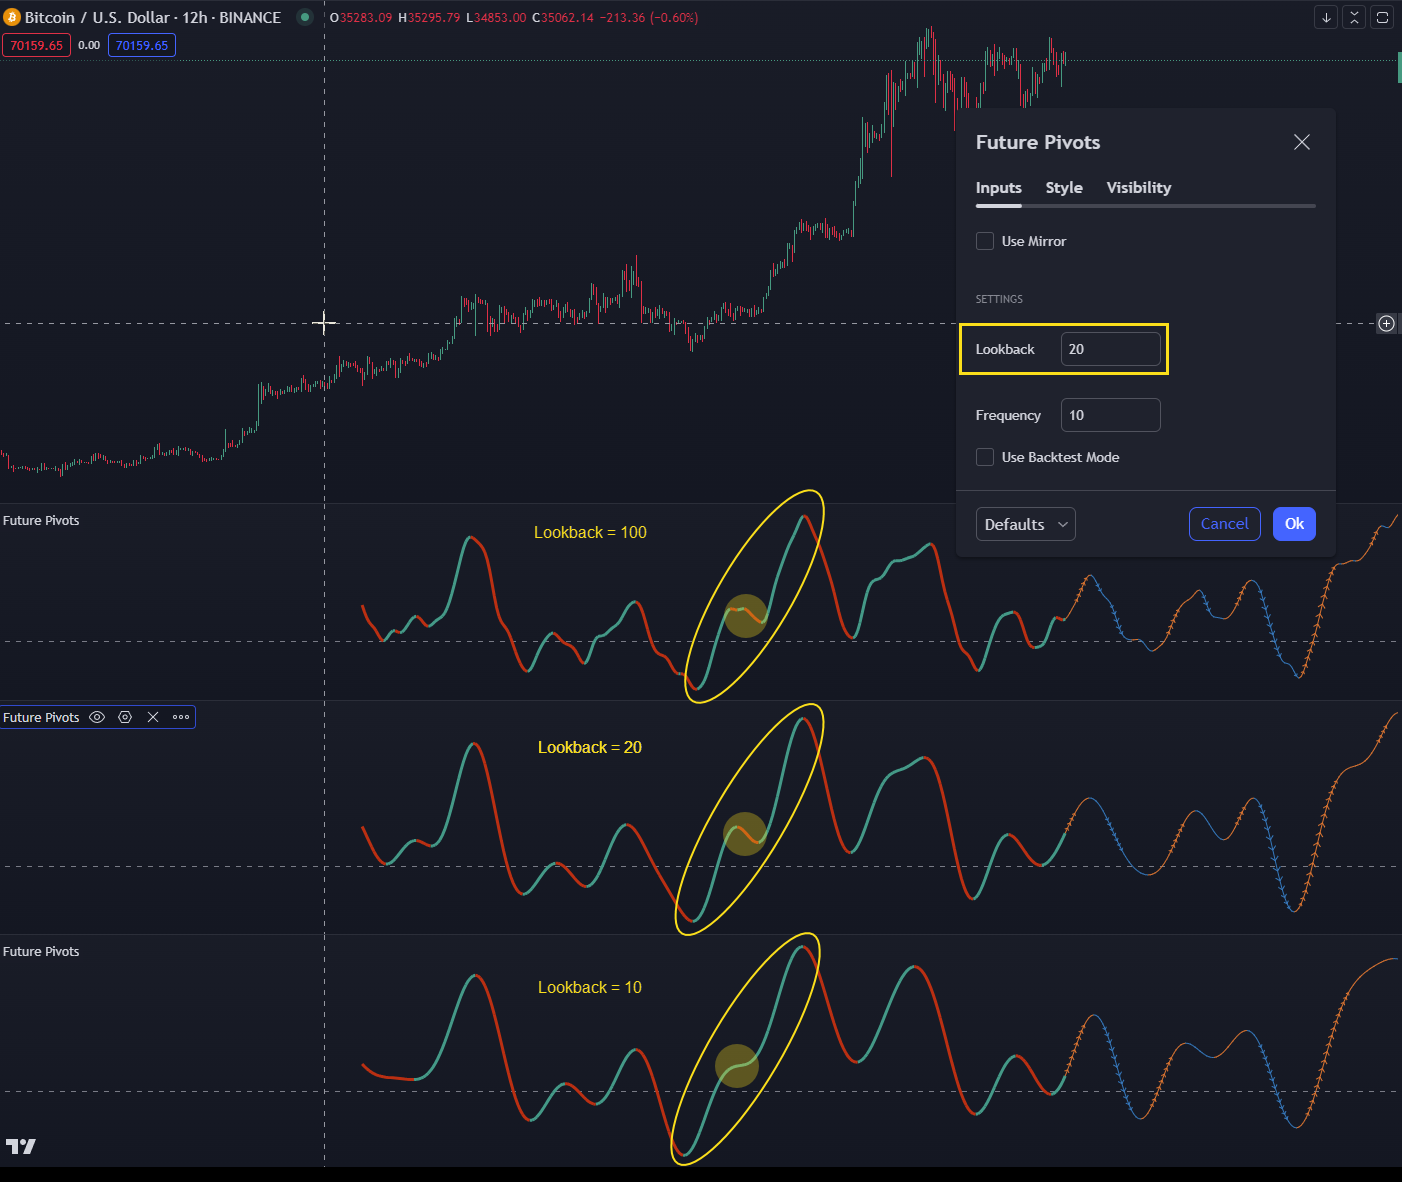
| Fig 1: Lower lookback can reduce noisy oscillations in ranging markets, while higher lookback captures broader swings. |
Lookback & Frequency Settings
Lookback
- Granularity vs. Smoothing: A lower lookback can filter out smaller fluctuations in sideways/ranging markets. A higher lookback (e.g., 100) may start to look like WaveTrend 3D, capturing broader oscillations more cleanly.
 |
|---|
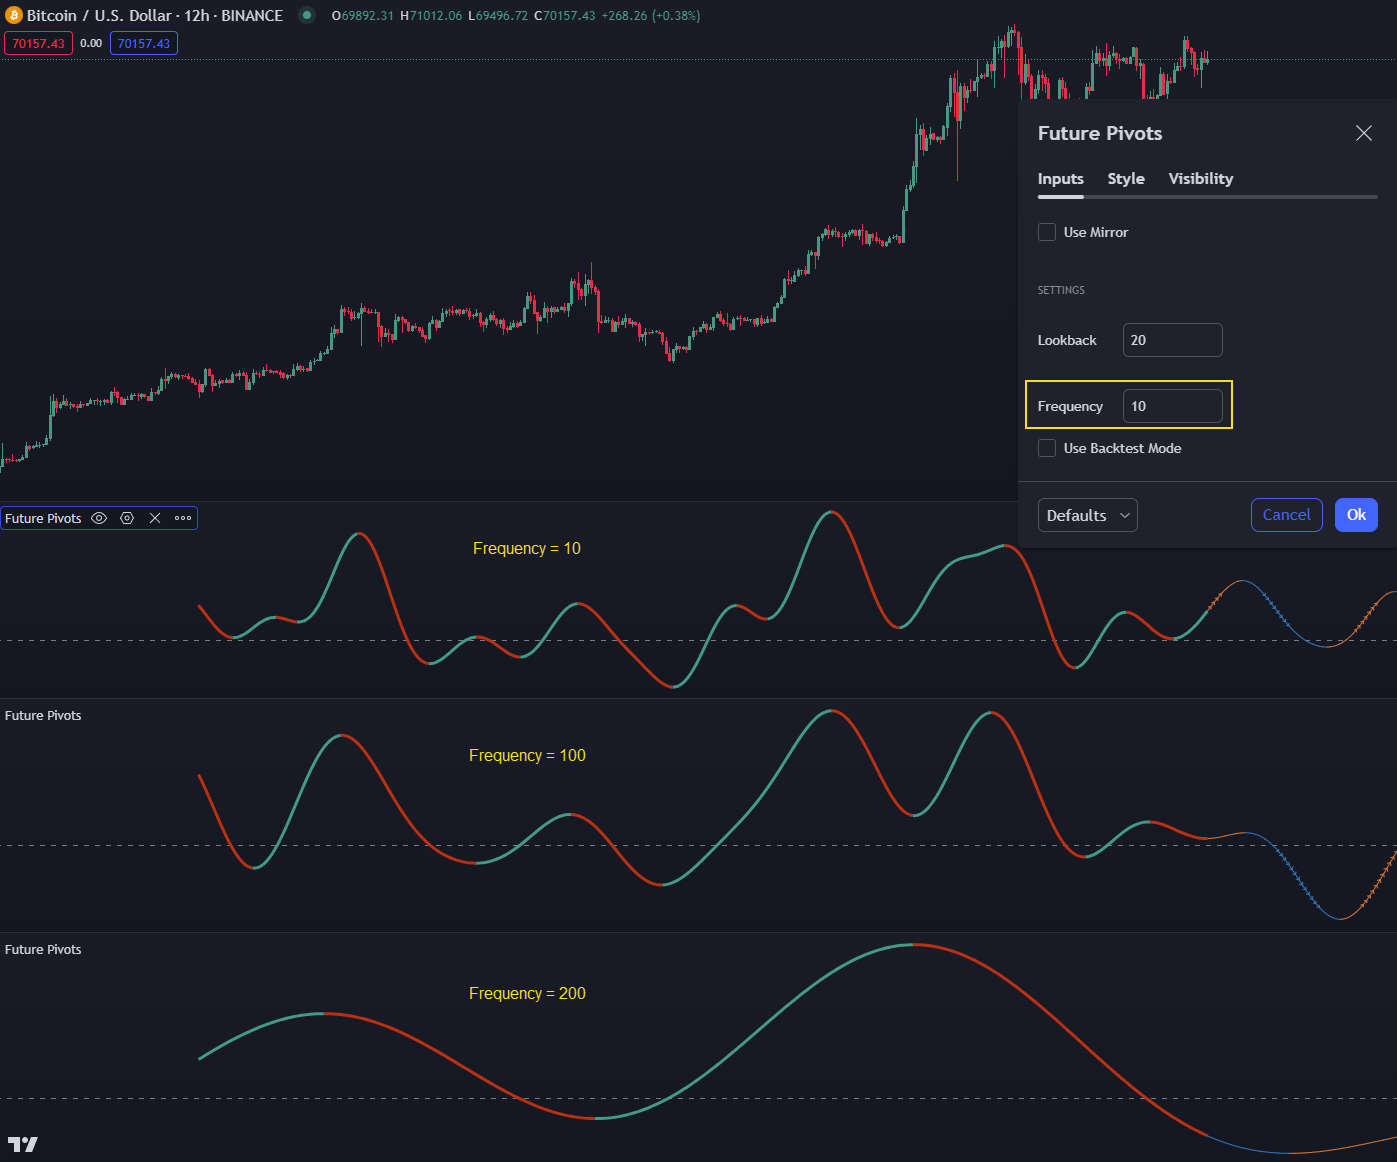
| Fig 2: Adjusting the frequency can shift pivot points, revealing different layers of market significance. |
Frequency
- Resembles Changing Timeframes: Altering frequency might spotlight certain pivots that aren’t as noticeable on default settings.
Backtest Mode
Visual Verification
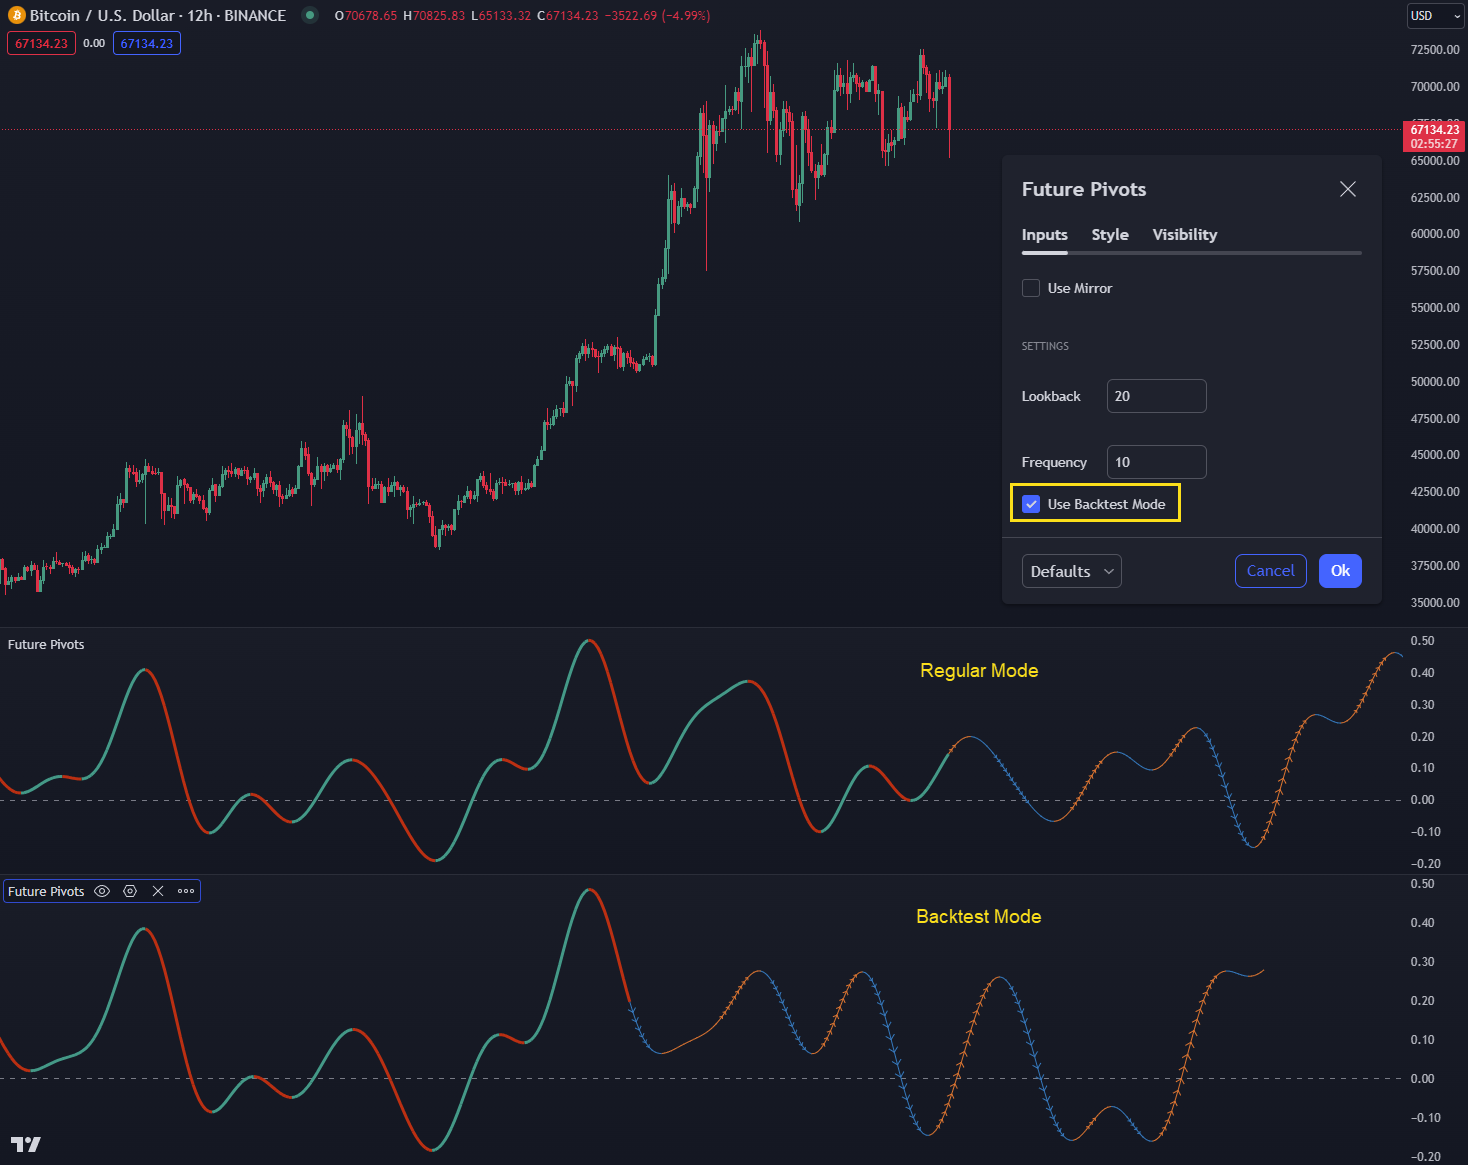
The Backtest Mode preserves a chunk of historical bars (a “validation set”) to show how your current FP settings might have performed in the past.
 |
|---|
| Fig 3: Enable Backtest Mode to see how FP would have flagged past pivots. |
 |
|---|
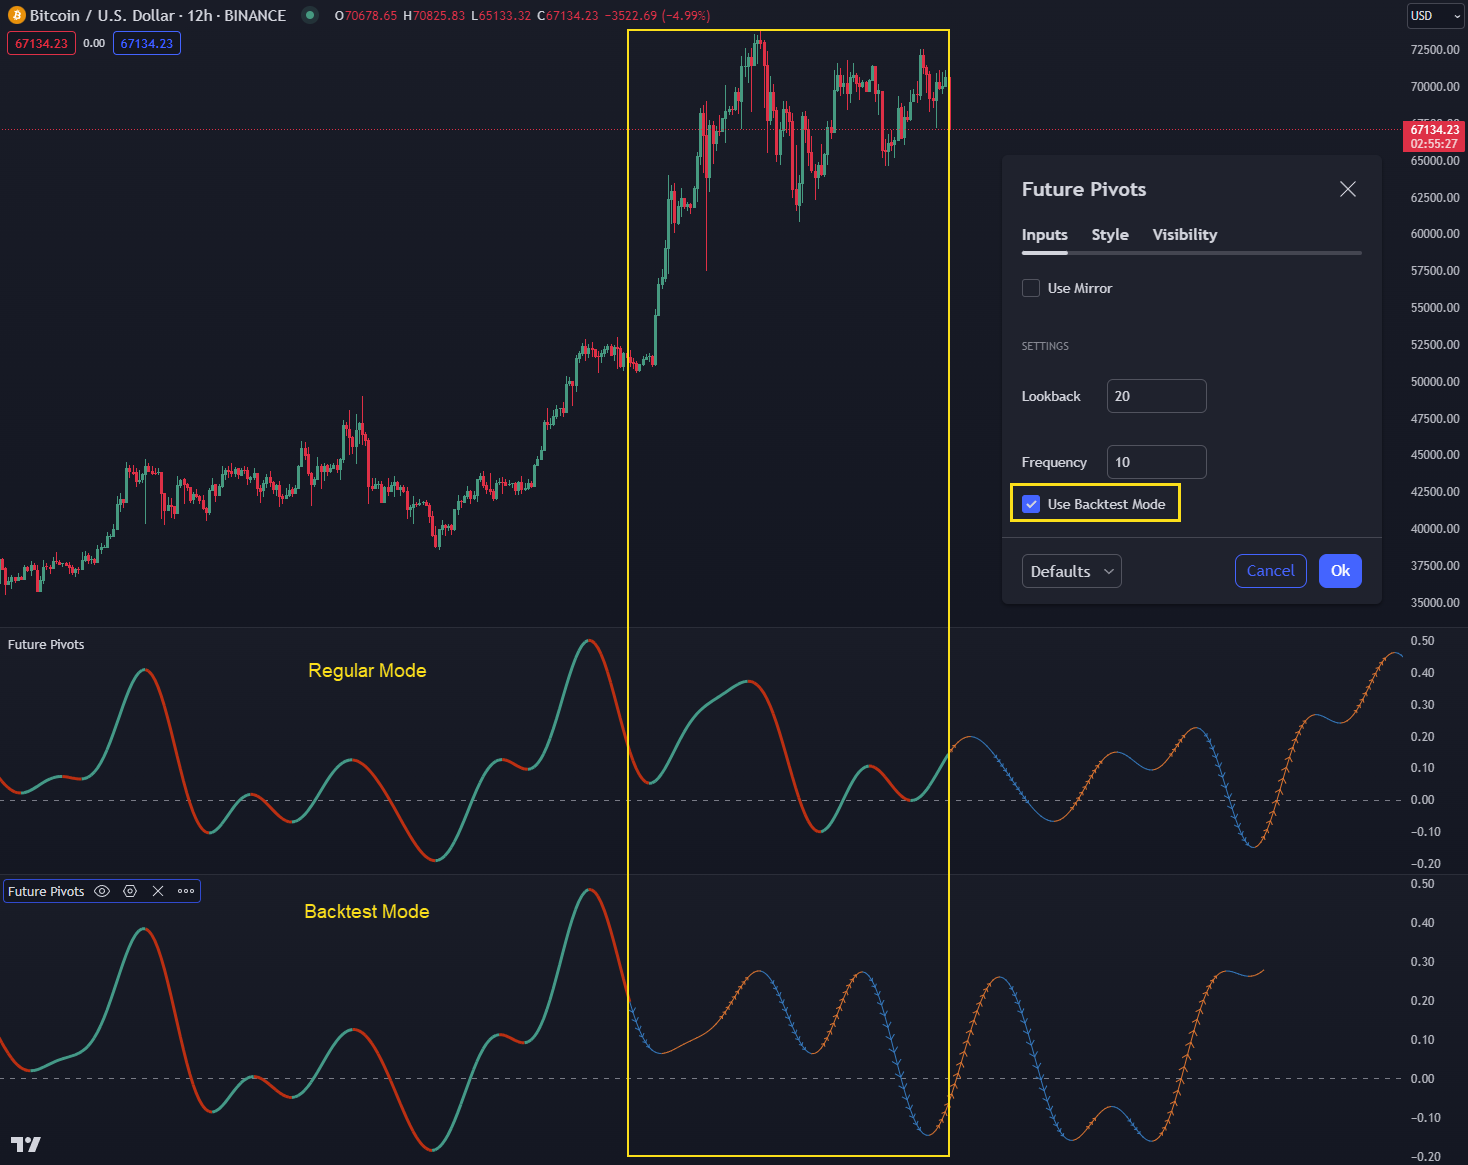
| Fig 4: Reserved bars serve as a validation set, aiding a visual check of FP's reliability. |
Look particularly for color changes (e.g., orange to blue) and median crossings—often correlating with future volatility spikes.
Mirrored Indicator View
Setting Up a Mirror
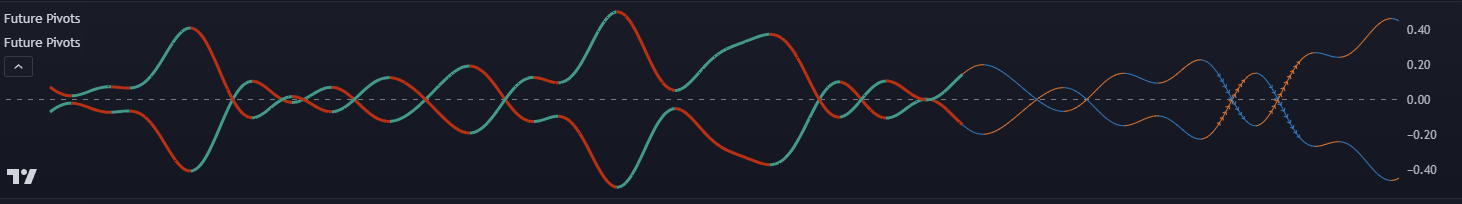
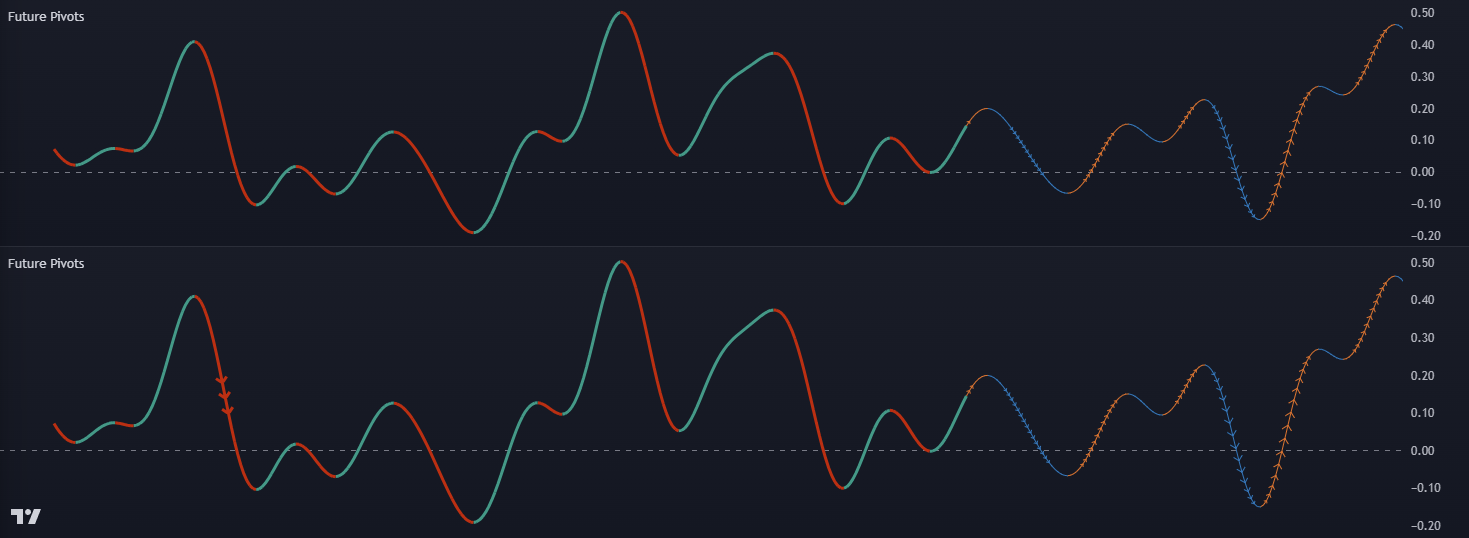
Mirroring FP provides a symmetrical, unbiased perspective. By duplicating the indicator and flipping one copy, you place pivot waves above and below a zero line:
 |
|---|
| Fig 5: Mirroring FP can help you focus on pivot timing without directional bias. |
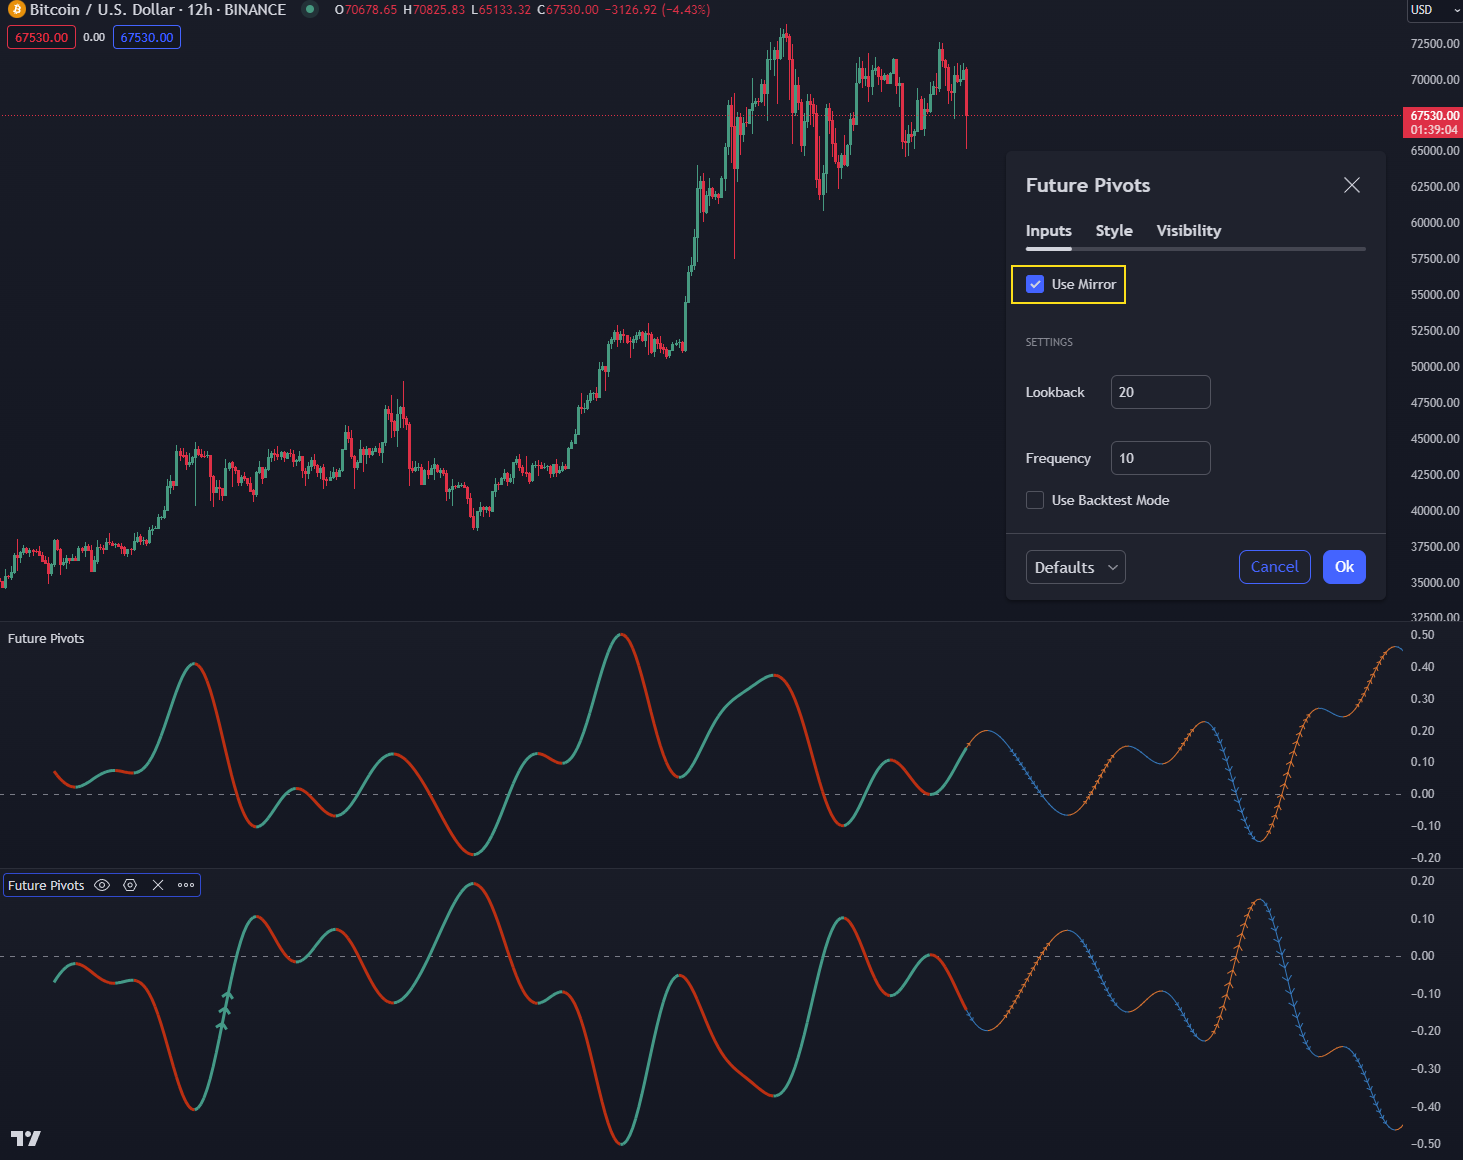
- Duplicate & Drag: Copy FP, then stack it on the same chart pane.
 |
|---|
| Fig 6: Duplicate Future Pivots and place it atop the original. |
- Enable "Use Mirror" in one of the copies.
 |
|---|
| Fig 7: The mirror toggle flips pivot signals across the median. |
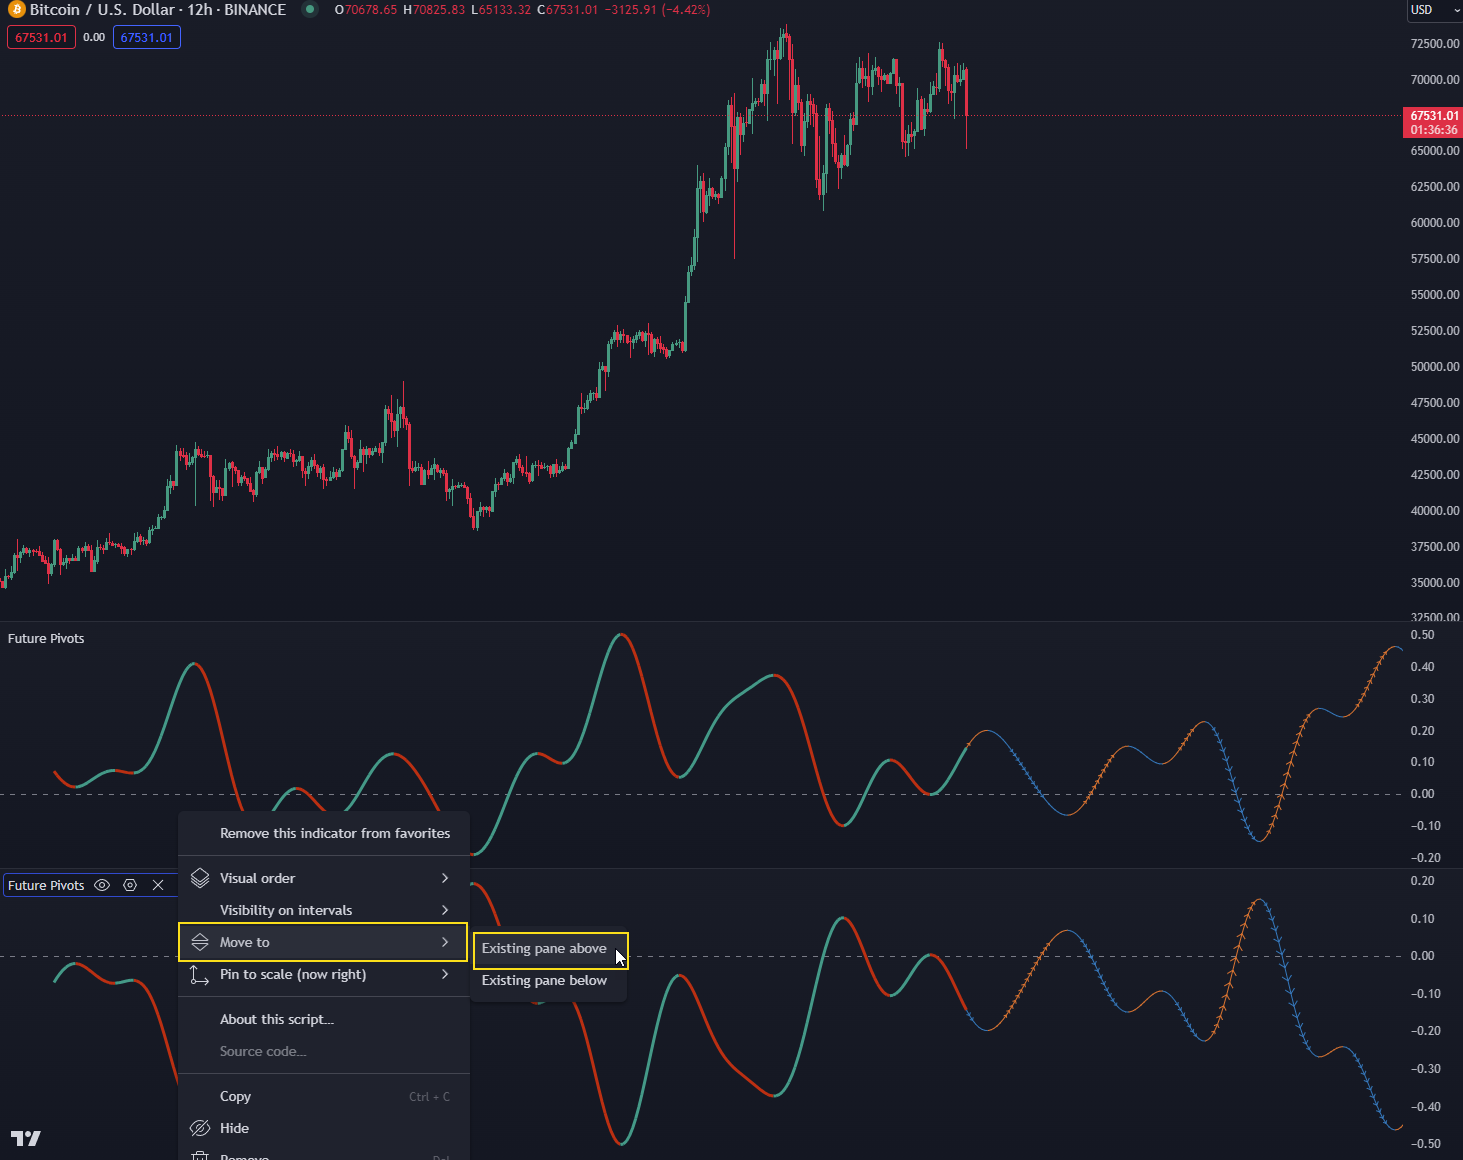
- Merge Panes: Move both FP indicators into the same pane.
 |
|---|
| Fig 8: Combining multiple FP copies into a single pane for mirroring. |
- Merge the Scales on the right-hand side.
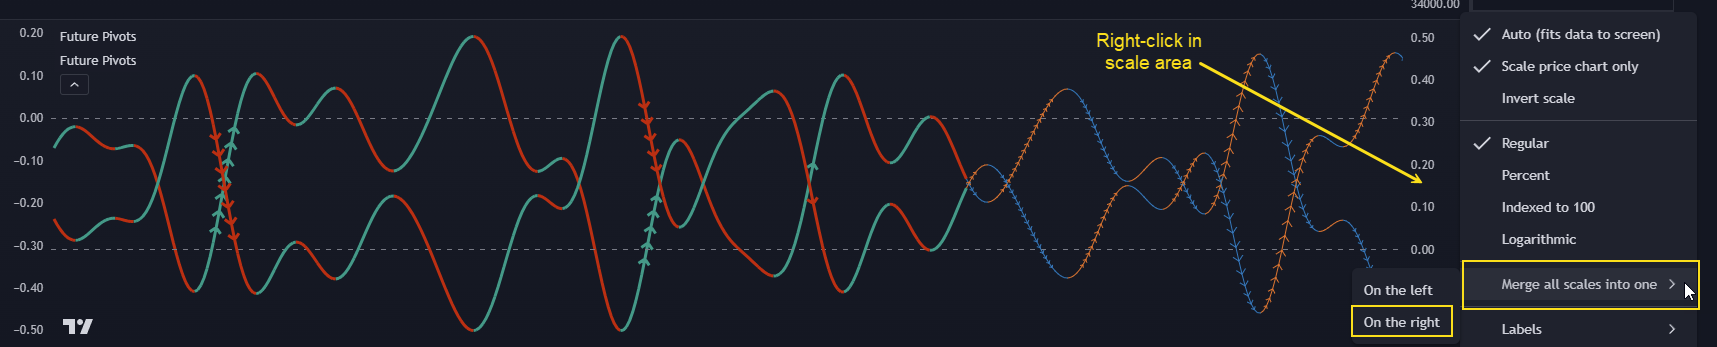 |
|---|
| Fig 9: Ensuring both copies share a unified scale for consistent mirroring. |
If done correctly, you’ll see a symmetrical “above/below zero” version of FP:
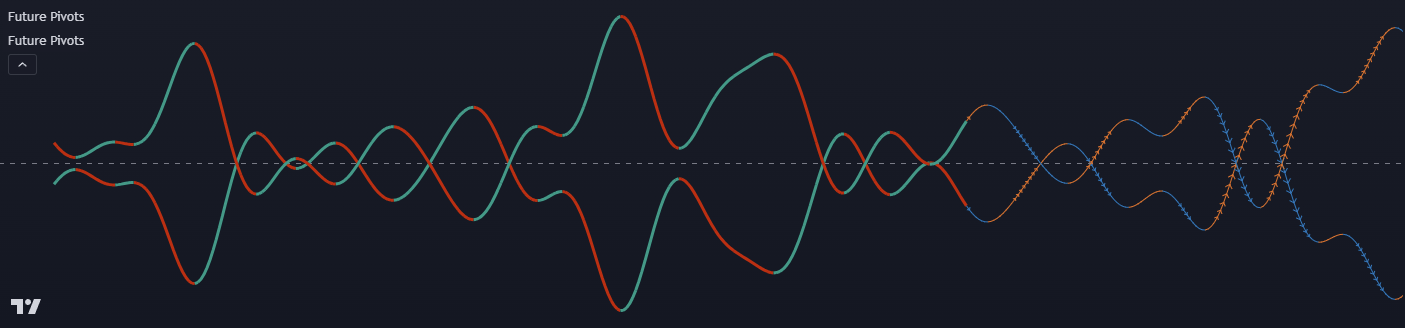 |
|---|
| Fig 10: A fully mirrored FP setup, making pivot timing more visually intuitive. |
Integration with Other Indicators
- Lorentzian Classification: Direct data feed isn’t possible, but overlaying both on a chart can yield powerful timing+direction synergy.
- WaveTrend 3D: Combine FP’s pivot windows with oscillator divergences or crossovers from WaveTrend 3D for robust trade signals.
Practical Applications
- Volatility Alerts: Use median crosses or color changes to anticipate periods of high volatility or potential breakout.
- Trend Continuation vs. Reversal: Let other direction-focused indicators confirm bullish/bearish bias after FP signals “it’s time to move.”
- Adaptive Strategy: Adjust lookback or frequency as the market shifts between ranging and trending states.
Conclusion
Future Pivots brings a unique dimension to technical analysis by centering on when to pay closer attention to the market’s next surge, reversal, or sideways phase. Through advanced smoothing, warping detection, and flexible settings, FP complements virtually any trading system. Understanding these Core Concepts—from price-time warping to mirrored views—will help you fully harness the indicator’s capabilities and elevate your timing game.