Future Pivots Indicator
This comprehensive guide will introduce you to the Future Pivots (FP) indicator—a timing-focused tool that marks potential points of significant market movement. You’ll discover how FP detects "price-time warping" and how it complements other systems like Lorentzian Classification or WaveTrend 3D.
Introduction
The Future Pivots (FP) indicator is a one-of-a-kind tool that zeroes in on when significant price action is likely to occur rather than predicting its directional outcome. By highlighting market “warp” moments—periods of abnormal volatility—FP helps traders prepare for pivotal moves, while leaving the ultimate bullish or bearish call to other indicators or your own analysis.
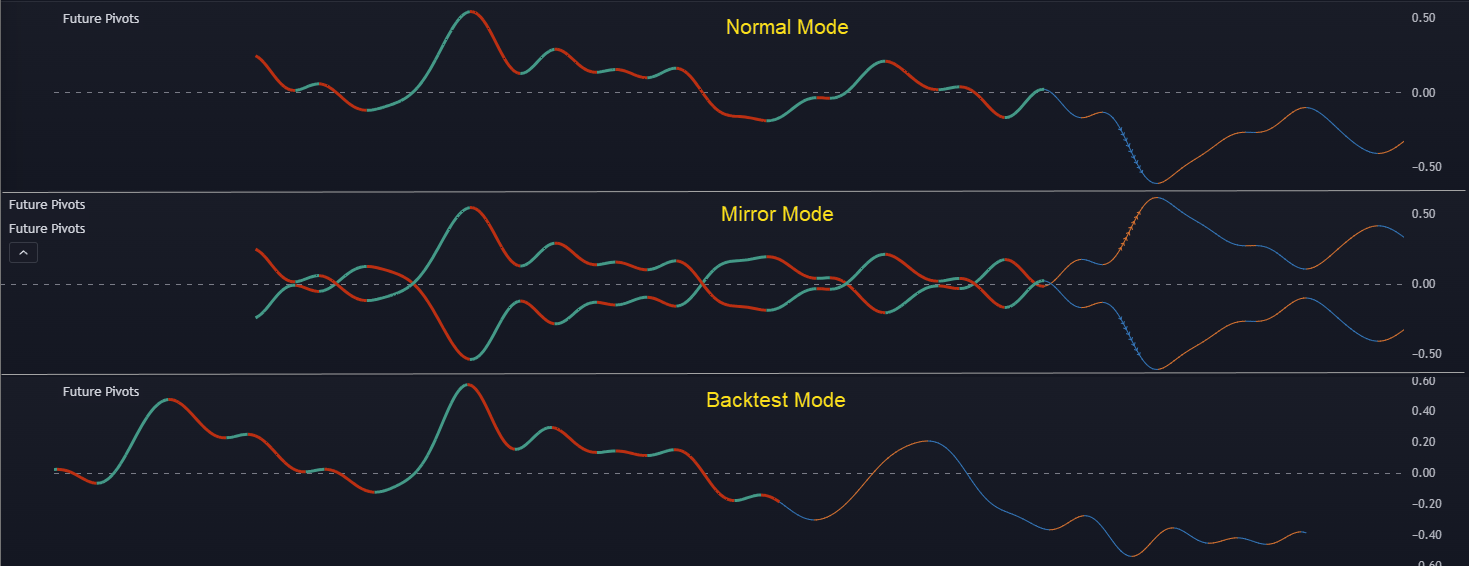 |
|---|
| Fig 1: A high-level look at the FP indicator output on a chart. |
Why This Matters
In fast-moving or volatile markets, traditional indicators often struggle to maintain accuracy when timing transitions. Future Pivots excels in these moments:
- Better Preparedness: Spot upcoming surges or collapses without committing to a bullish or bearish stance prematurely.
- Enhanced Compatibility: FP seamlessly integrates into almost any trading strategy, serving as a robust “timing confluence” tool.
How Future Pivots Works
Future Pivots harnesses advanced signal extraction and smoothing techniques (e.g., inverse Fisher transform, hyperbolic tangent normalization). These identify pivotal market frequencies—especially those aligning with the current timeframe’s “dominant cycle.”
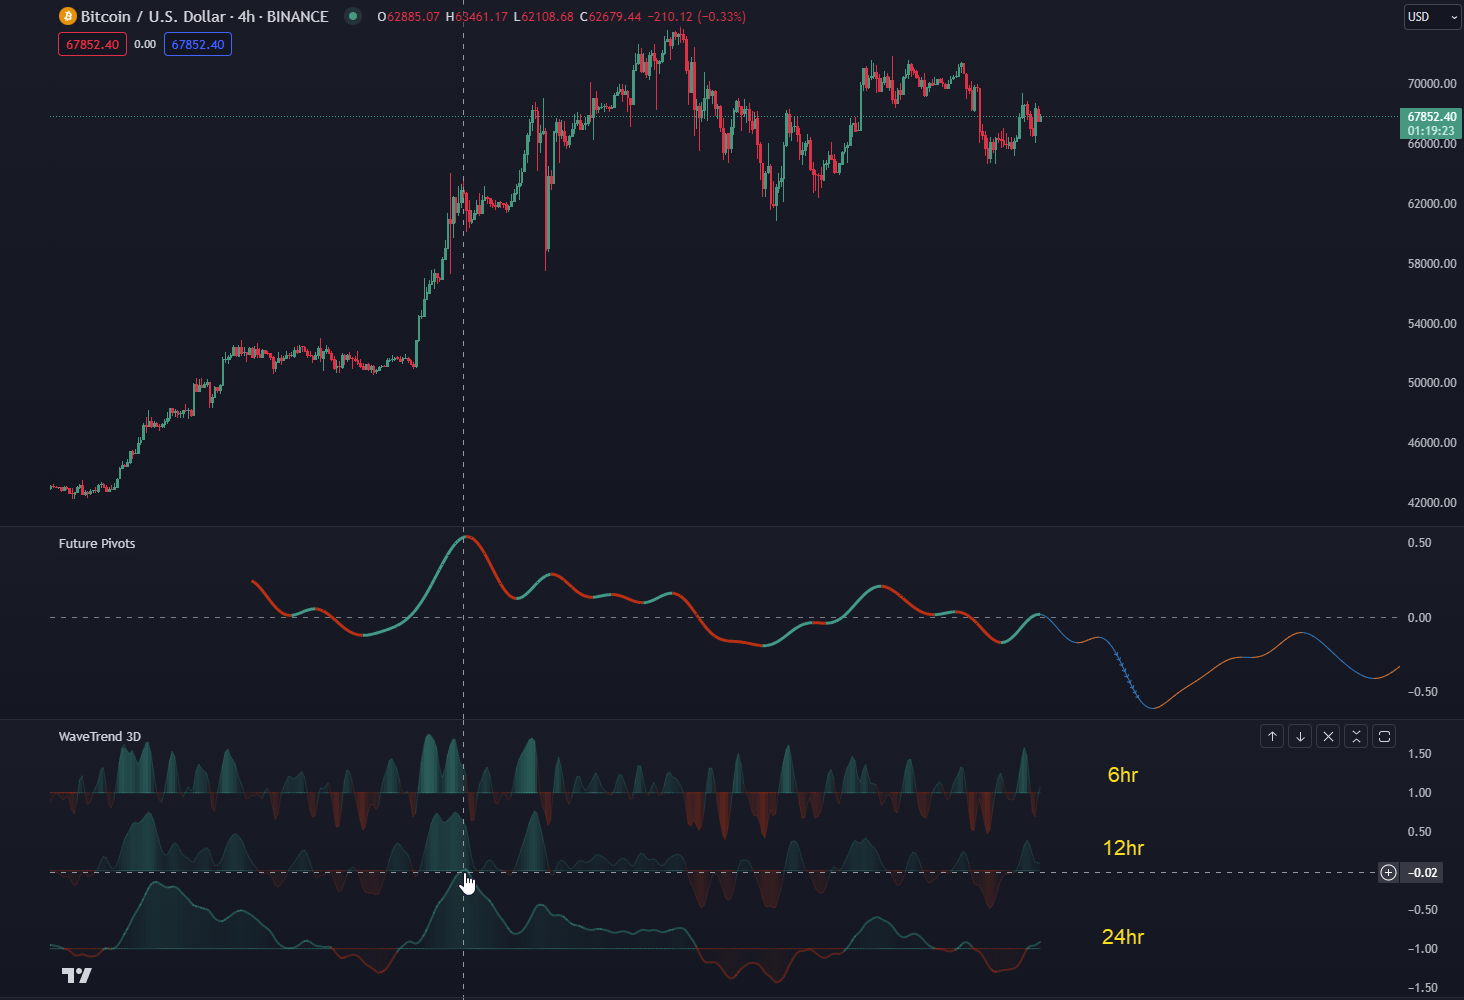 |
|---|
| Fig 2: FP visualizing potential warp points (plotted in the future) on a 12-hour chart. |
Sometimes, FP’s curve can appear like a truncated oscillator that projects ahead. This is not a directional prediction but a timing tool that flags spots for high potential volatility or momentum shifts.
What This Means for Traders
By focusing on “when” moves might happen rather than “which way,” traders can:
- Time Trades More Precisely: Use FP to know when a large move might occur, then consult indicators like Lorentzian Classification or WaveTrend 3D to gauge direction.
- Adapt to “Warped” Markets: FP detects moments of price-time distortion, helping traders avoid being blindsided by sudden volatility.
- Utilize Flexible Settings & Backtesting: Adjust lookback and frequency to refine pivot detection. The built-in backtest mode provides visual feedback for fine-tuning.
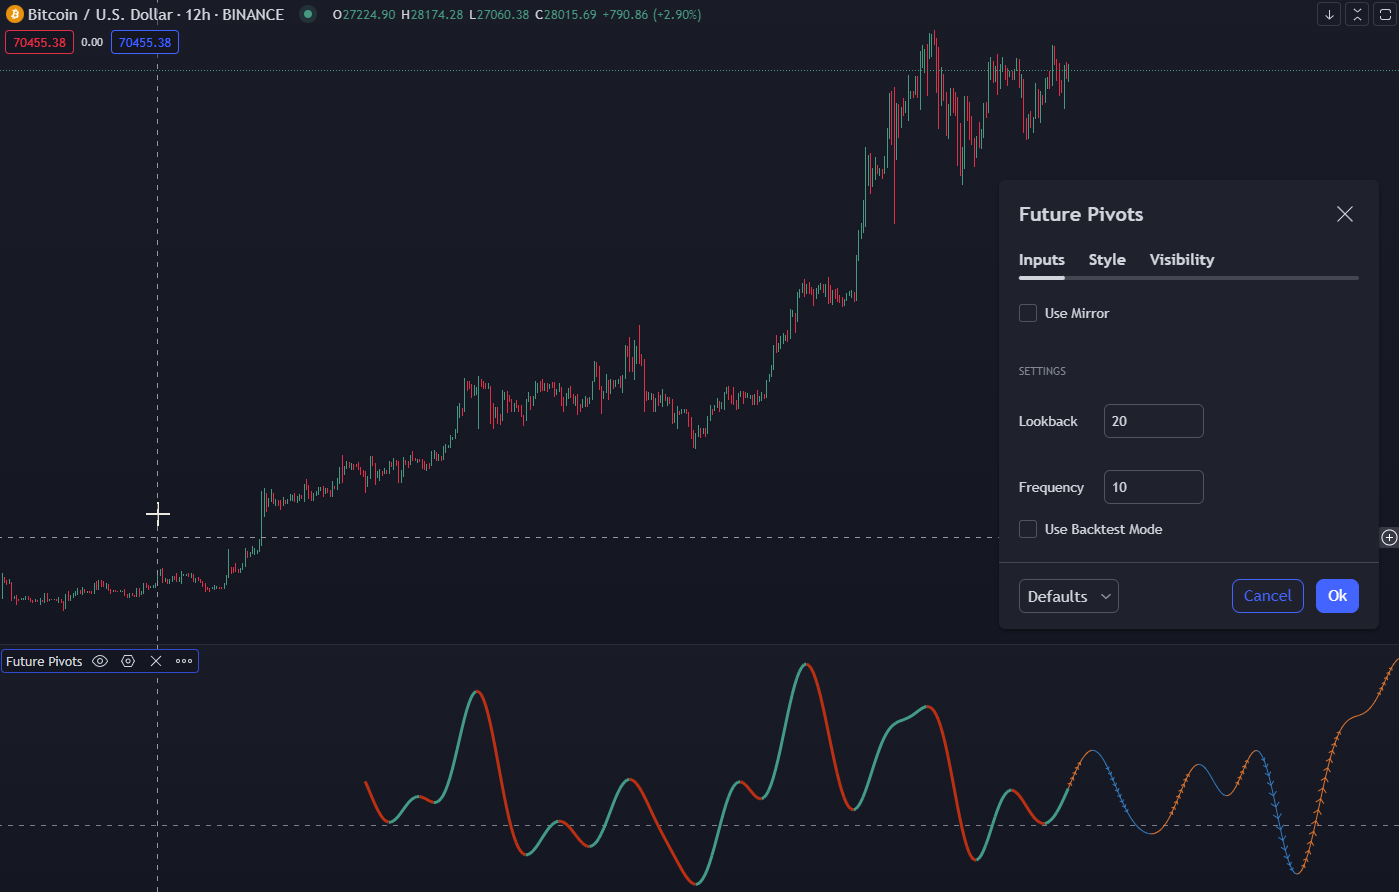 |
|---|
| Fig 3: The main FP settings panel, offering lookback and frequency adjustments. |
You can even spot chart patterns more clearly—like the inverse head and shoulders shown below—where the final color change often coincides with significant breaks to the upside or swift reversals.
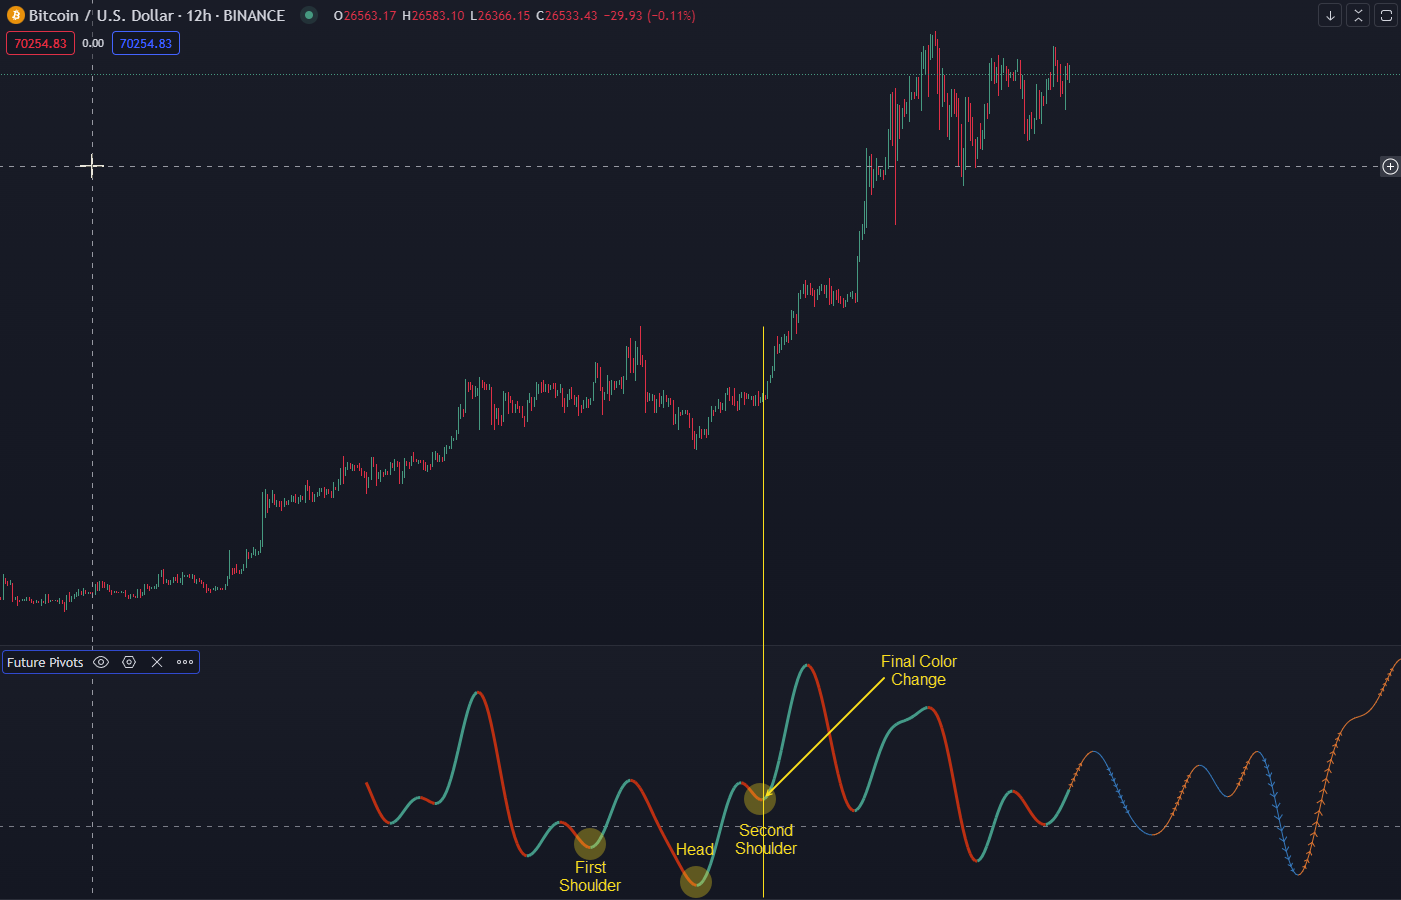 |
|---|
| Fig 4: Example of an inverse head and shoulders pattern aligning with FP's final color change. |
What This Guide Covers
In the sections that follow, you’ll learn:
- Core Concepts like price-time warping, lookback frequency, pivot visualization, and mirrored views.
- How to Set Up Backtest Mode to evaluate FP’s reliability on historical data.
- Integration Tips for combining FP with other indicators, including Lorentzian Classification.
While Future Pivots cannot directly feed into Lorentzian Classification due to technical differences, it still pairs beautifully as an additional layer of timing analysis.