Understanding Core Concepts
While traditional WaveTrend indicators rely heavily on overbought/oversold conditions and single-timeframe divergences, Wavetrend 3D redefines the landscape by stitching together multiple “speeds” (or timeframes) into one harmonized view. Below, we break down key ideas powering Wavetrend 3D.
Multi-Timeframe Oscillators
Why “3D” Matters
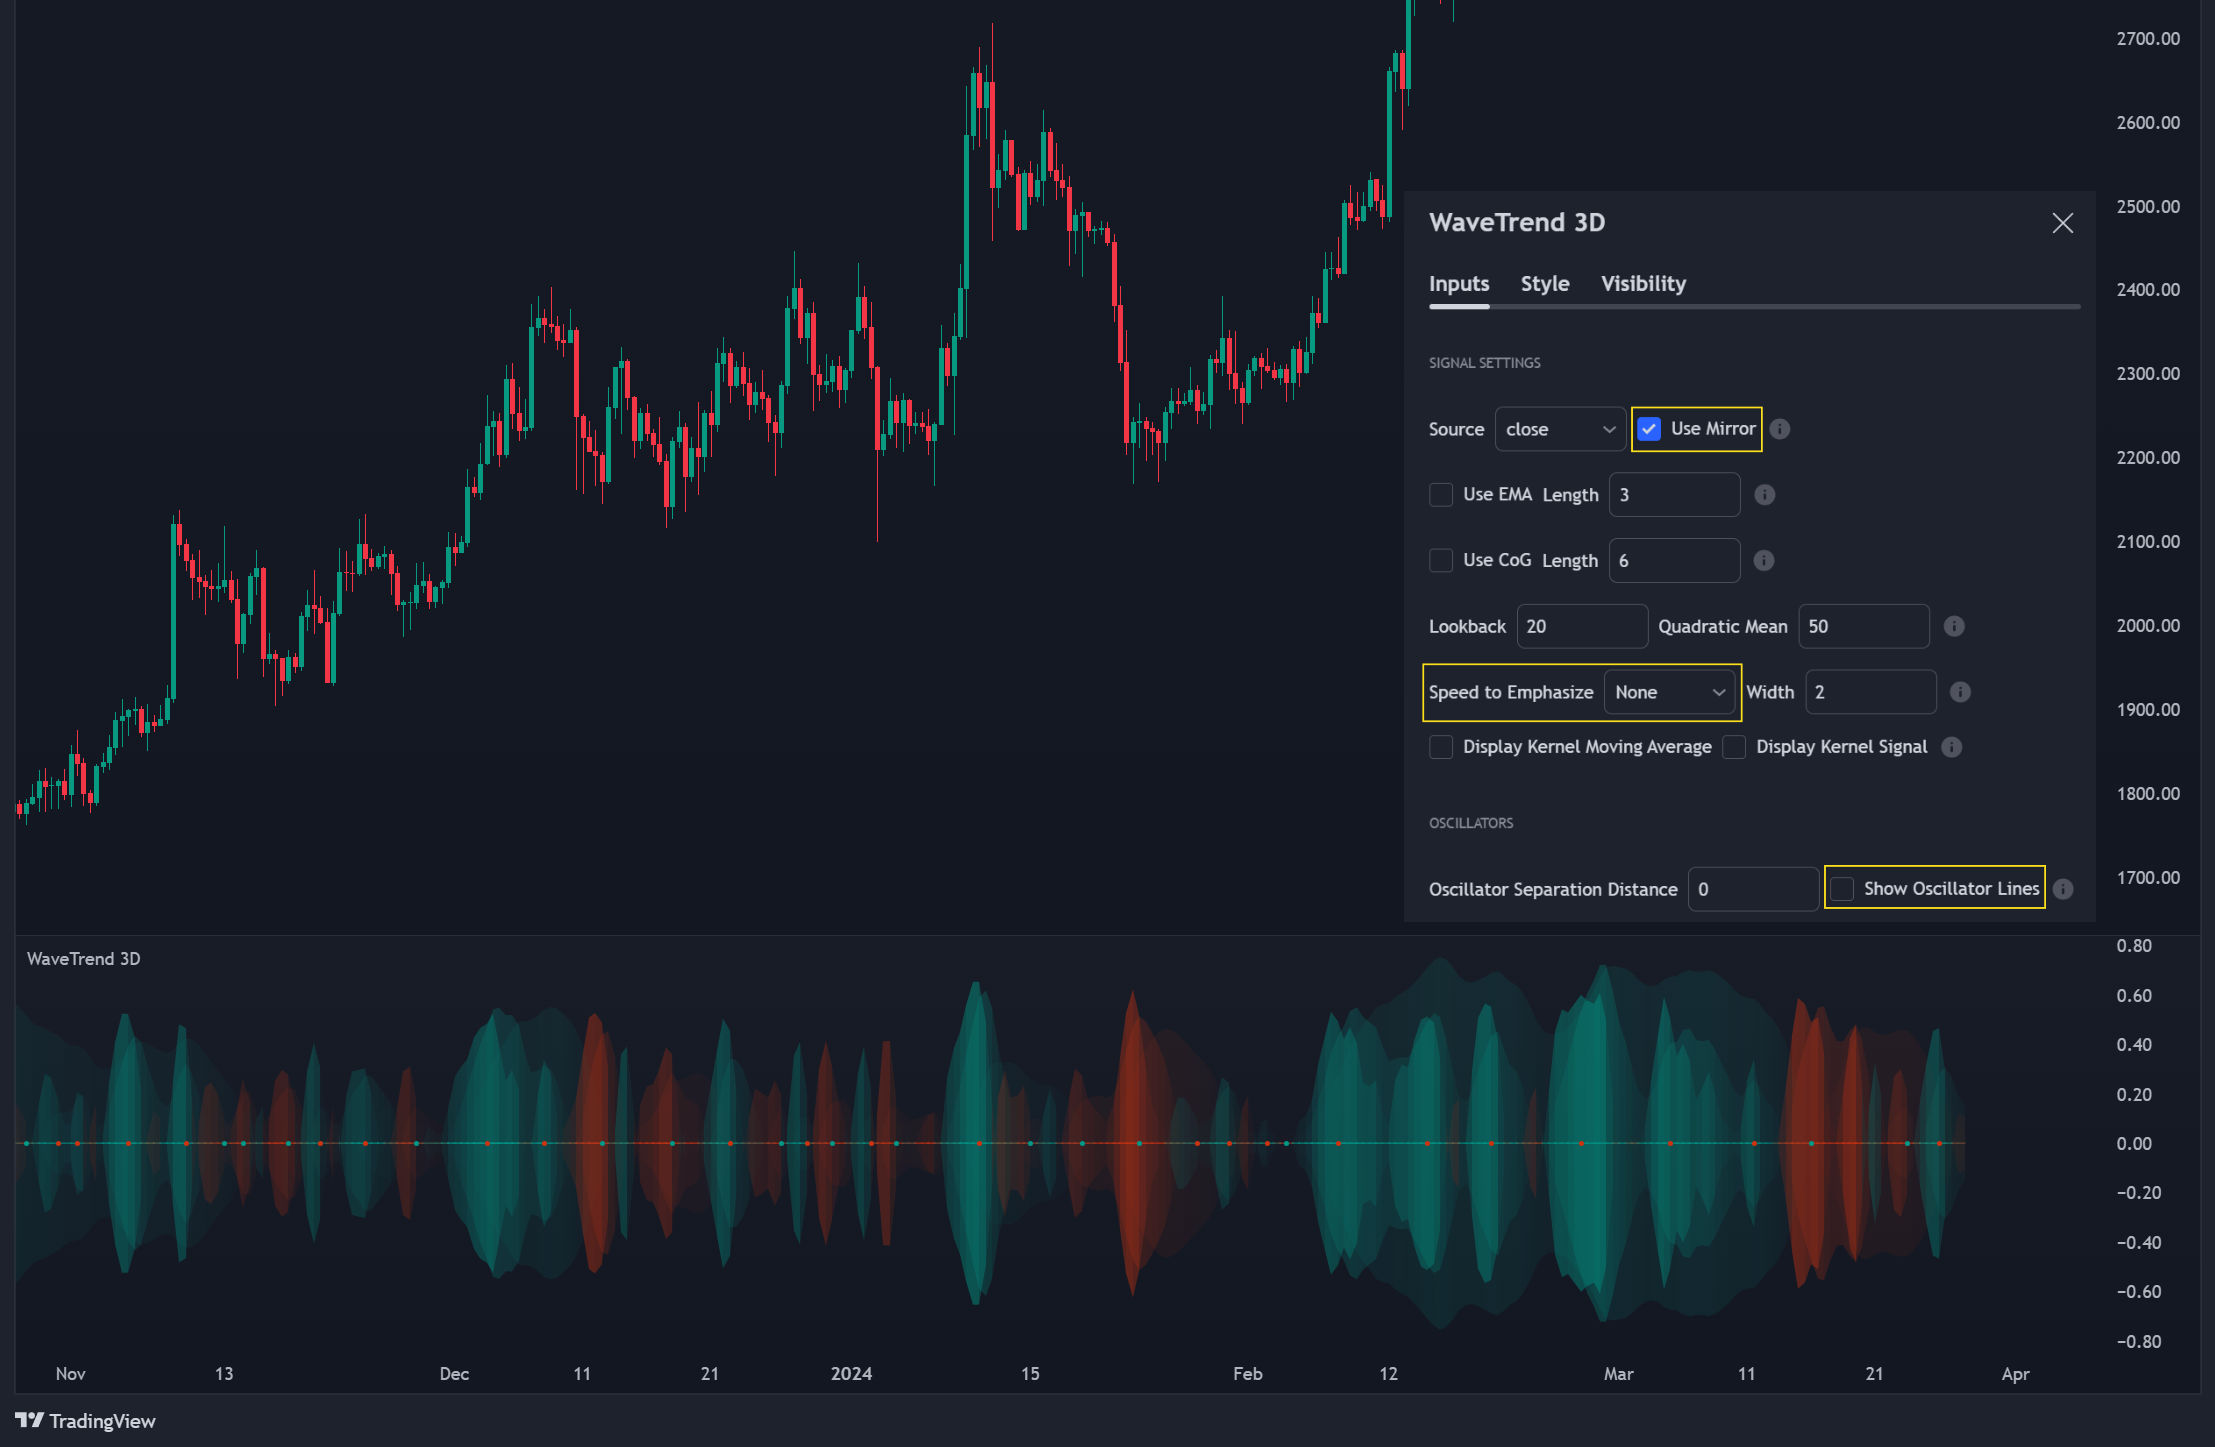
Markets don’t move in purely 2D. Trend shifts on a 4-hour chart can overshadow signals on a 1-hour chart. Wavetrend 3D addresses this by blending three oscillators:
- Fast (e.g., ~6-hour on a 12-hour chart)
- Normal (the main timeframe, e.g., 12-hour)
- Slow (a broader perspective, e.g., daily)
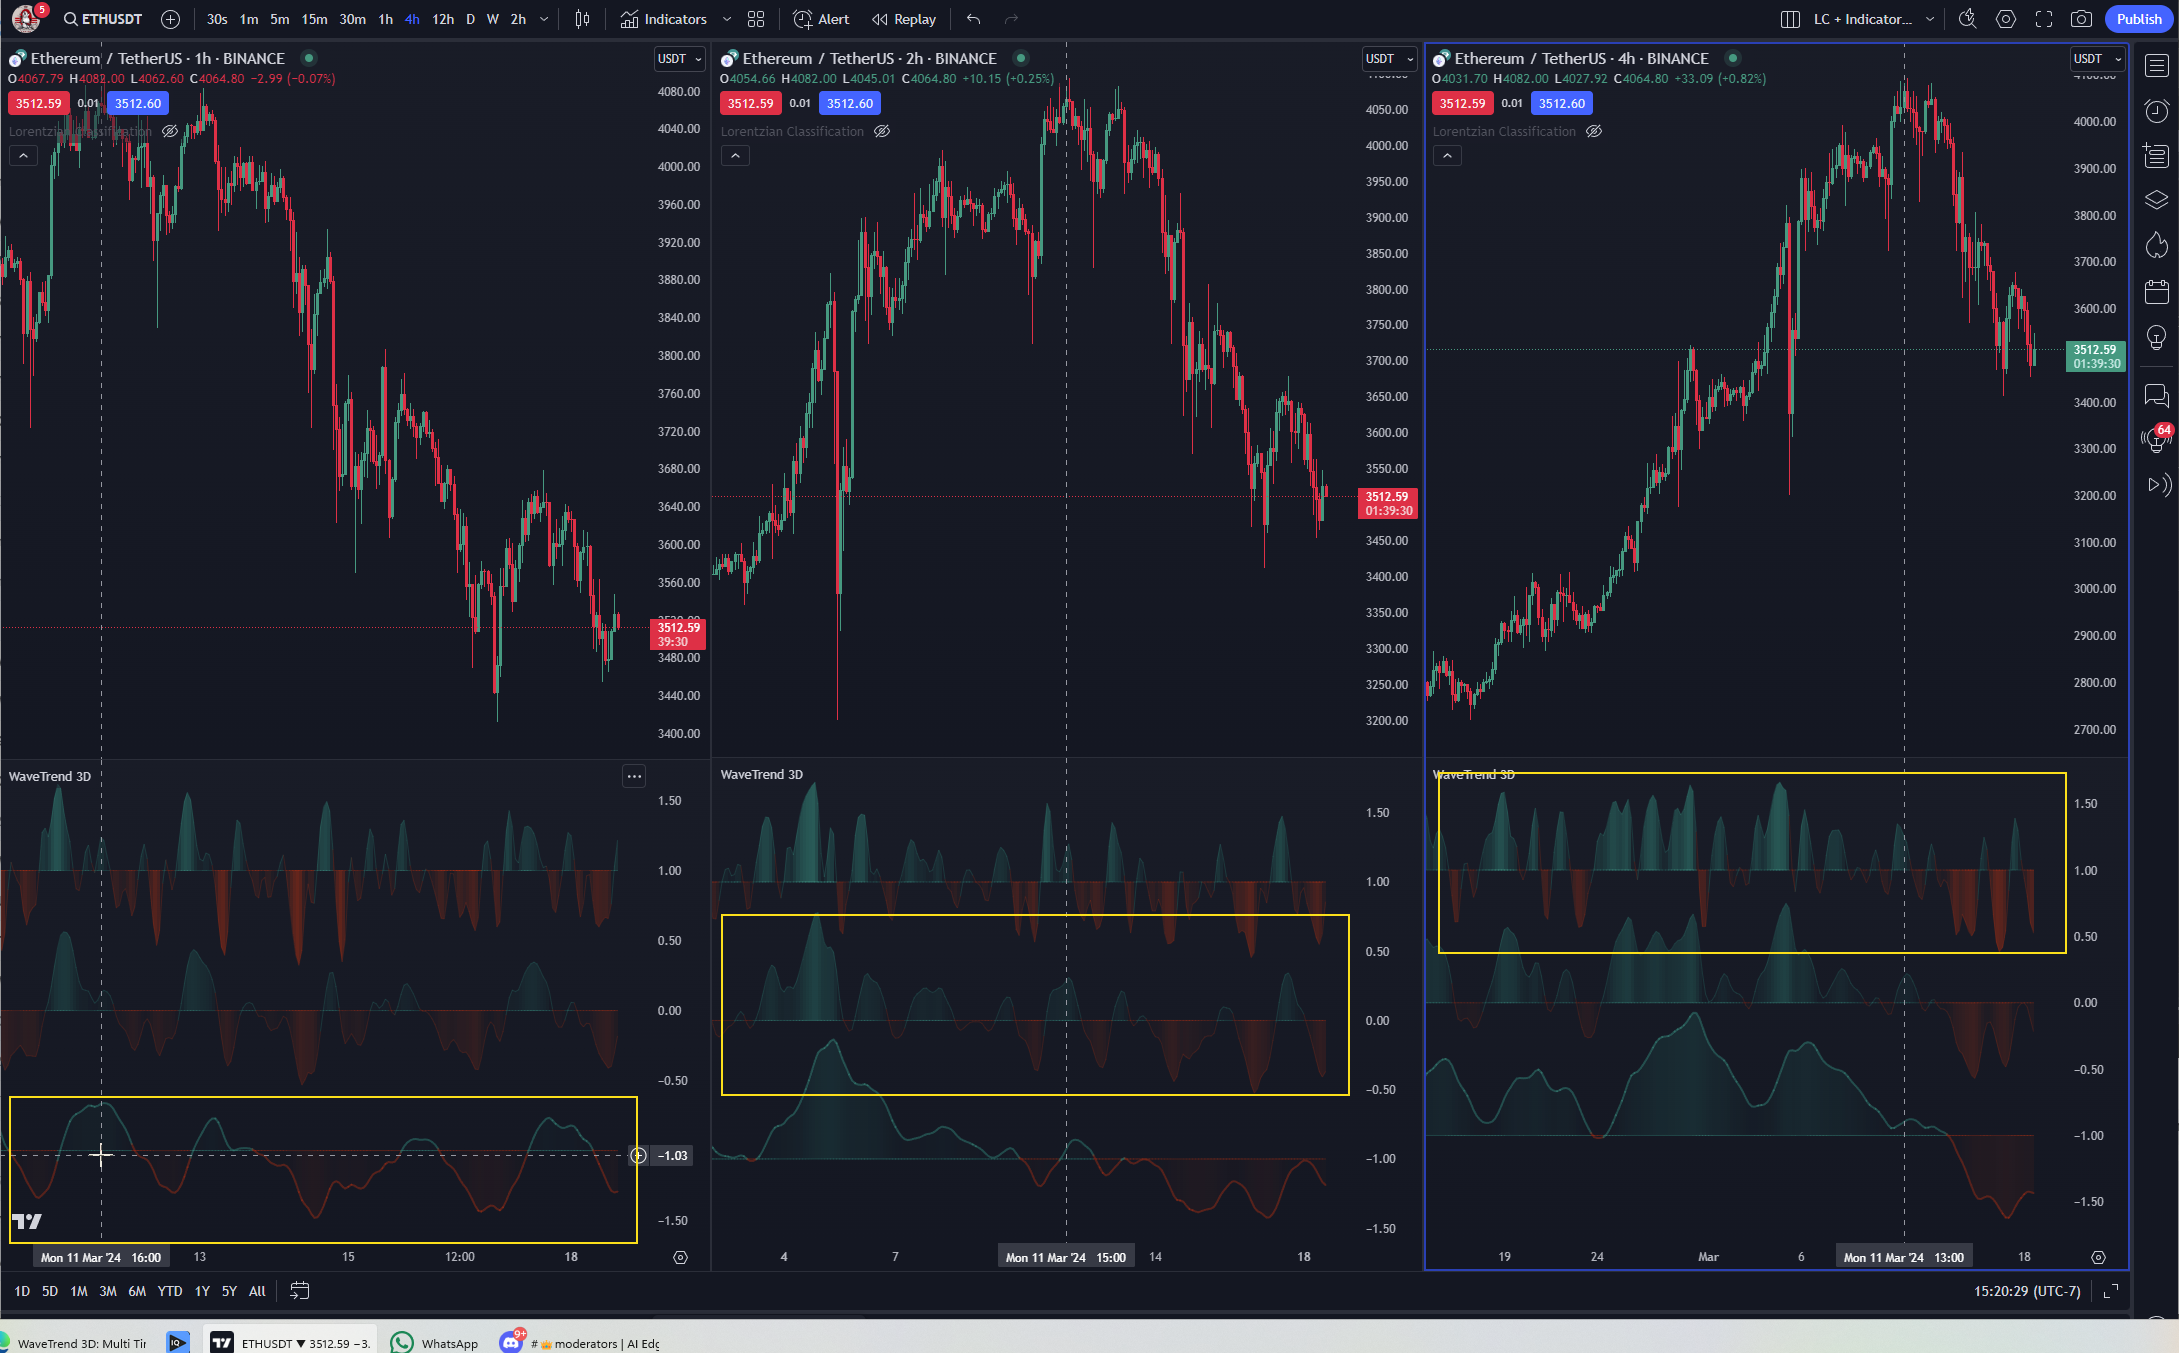 |
|---|
| Fig 1: Separate fast, normal, and slow oscillators on different timeframes. |
This reveals how multiple timeframes intersect, highlighting when fast and normal align or conflict with the slow oscillator.
Small Circles & Big Circles
Small Circles (Fast vs. Normal Crosses)
Small circles appear when the fast oscillator crosses the normal oscillator:
- Red Circle Above Zero: Potential bearish correction.
- Green Circle Below Zero: Potential bullish reversal.
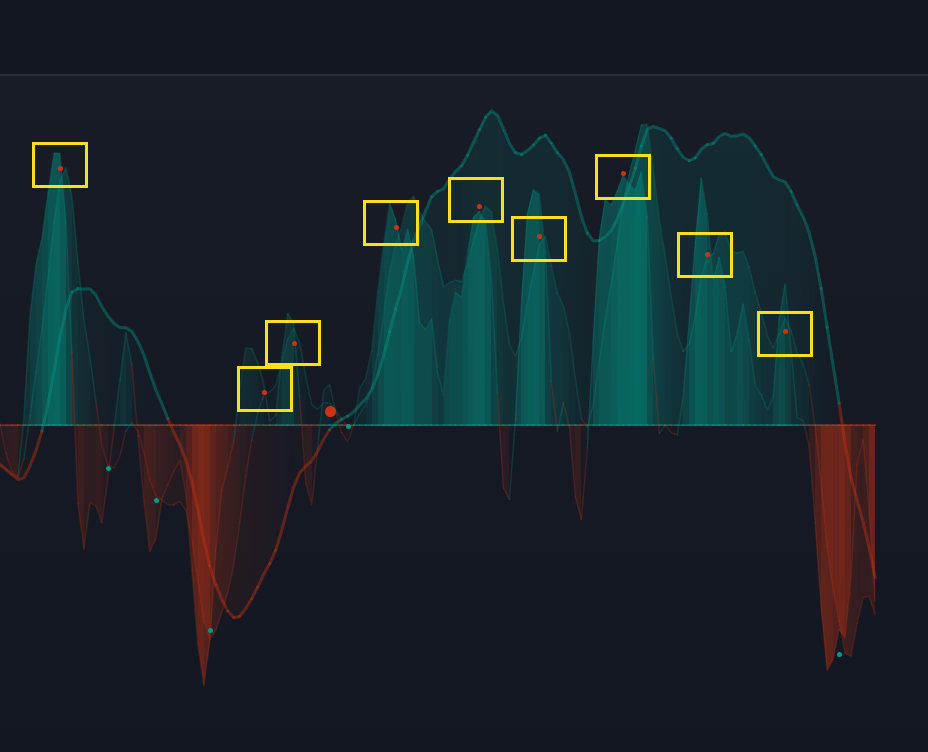 |
|---|
| Fig 2: Fast crosses normal above zero, generating a small red circle signal. |
 |
|---|
| Fig 3: Fast crosses normal below zero, generating a small green circle signal. |
Big Circles (Potential Trigger Waves)
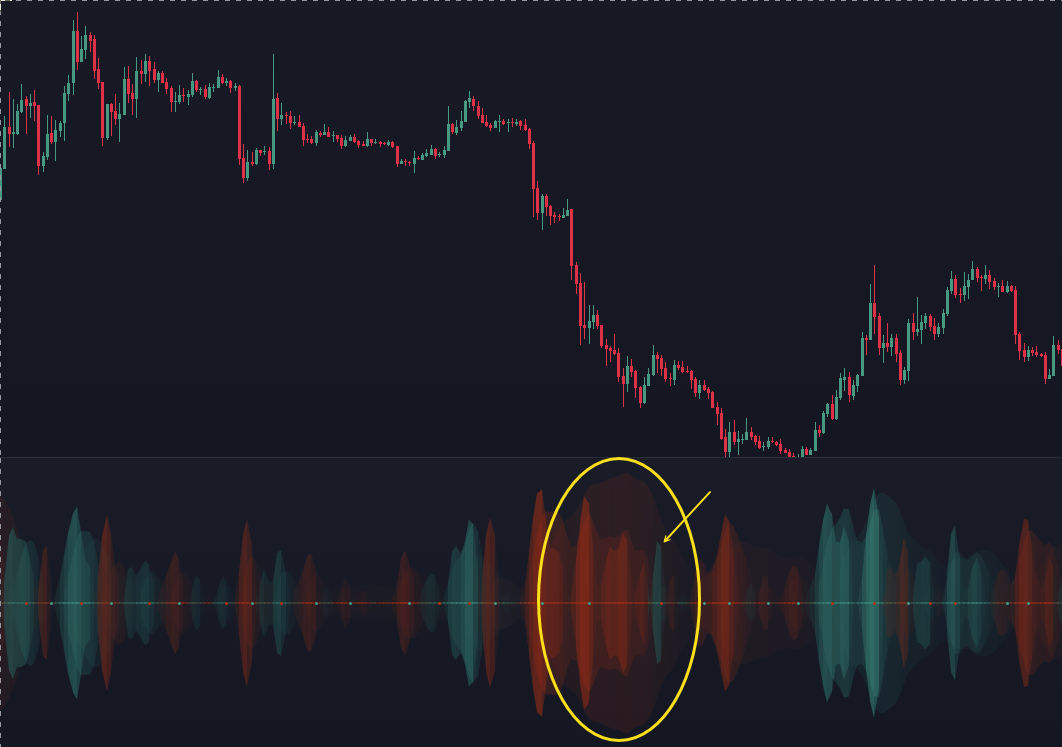
Big circles mark a possible divergence wave—often a reduced-amplitude crossover compared to a prior wave. These can precede stronger moves.
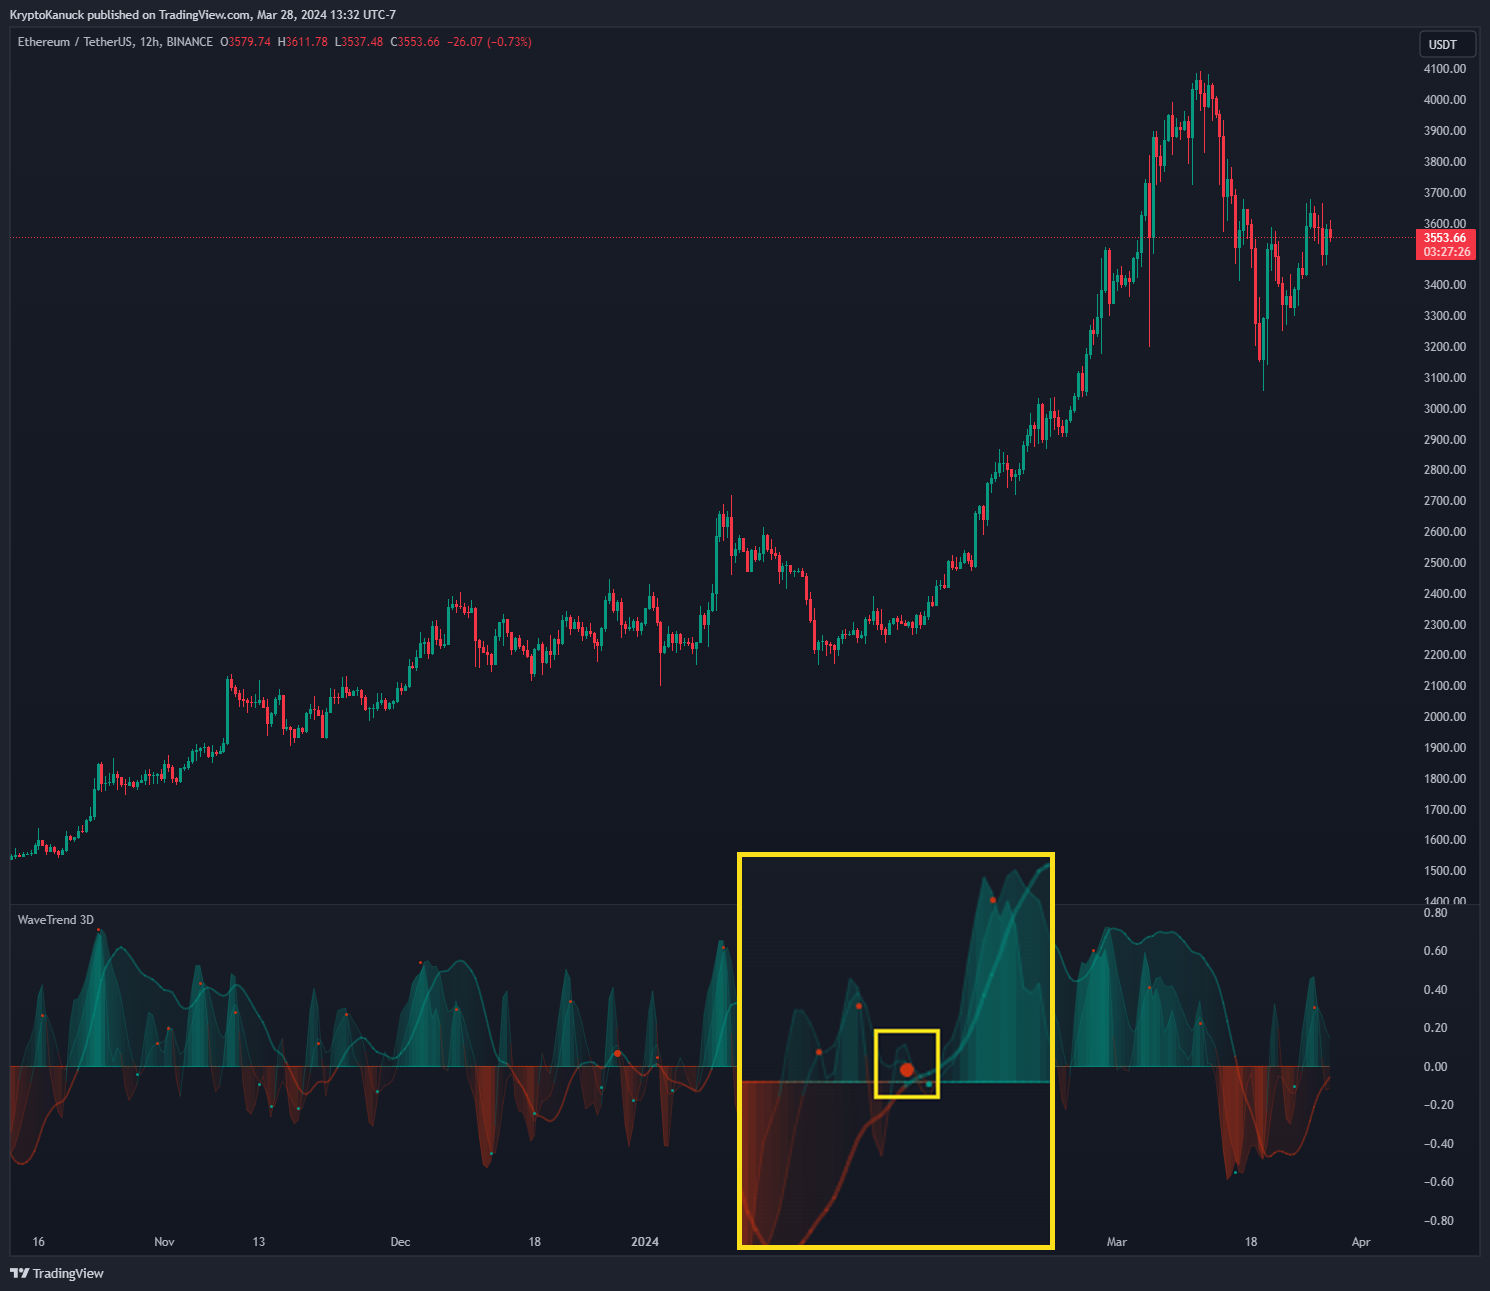 |
|---|
| Fig 4: A bullish trigger wave forming at lower amplitude than a prior bearish wave. |
Mirrored Mode
Mirroring signals across zero provides an alternate lens: bullish oscillations reflect upward, bearish oscillations invert downward.
 |
|---|
| Fig 5: Mirrored mode for a different perspective on oscillator alignment. |
 |
|---|
| Fig 6: Identifying smaller bullish/bearish “bubbles” within a larger wave. |
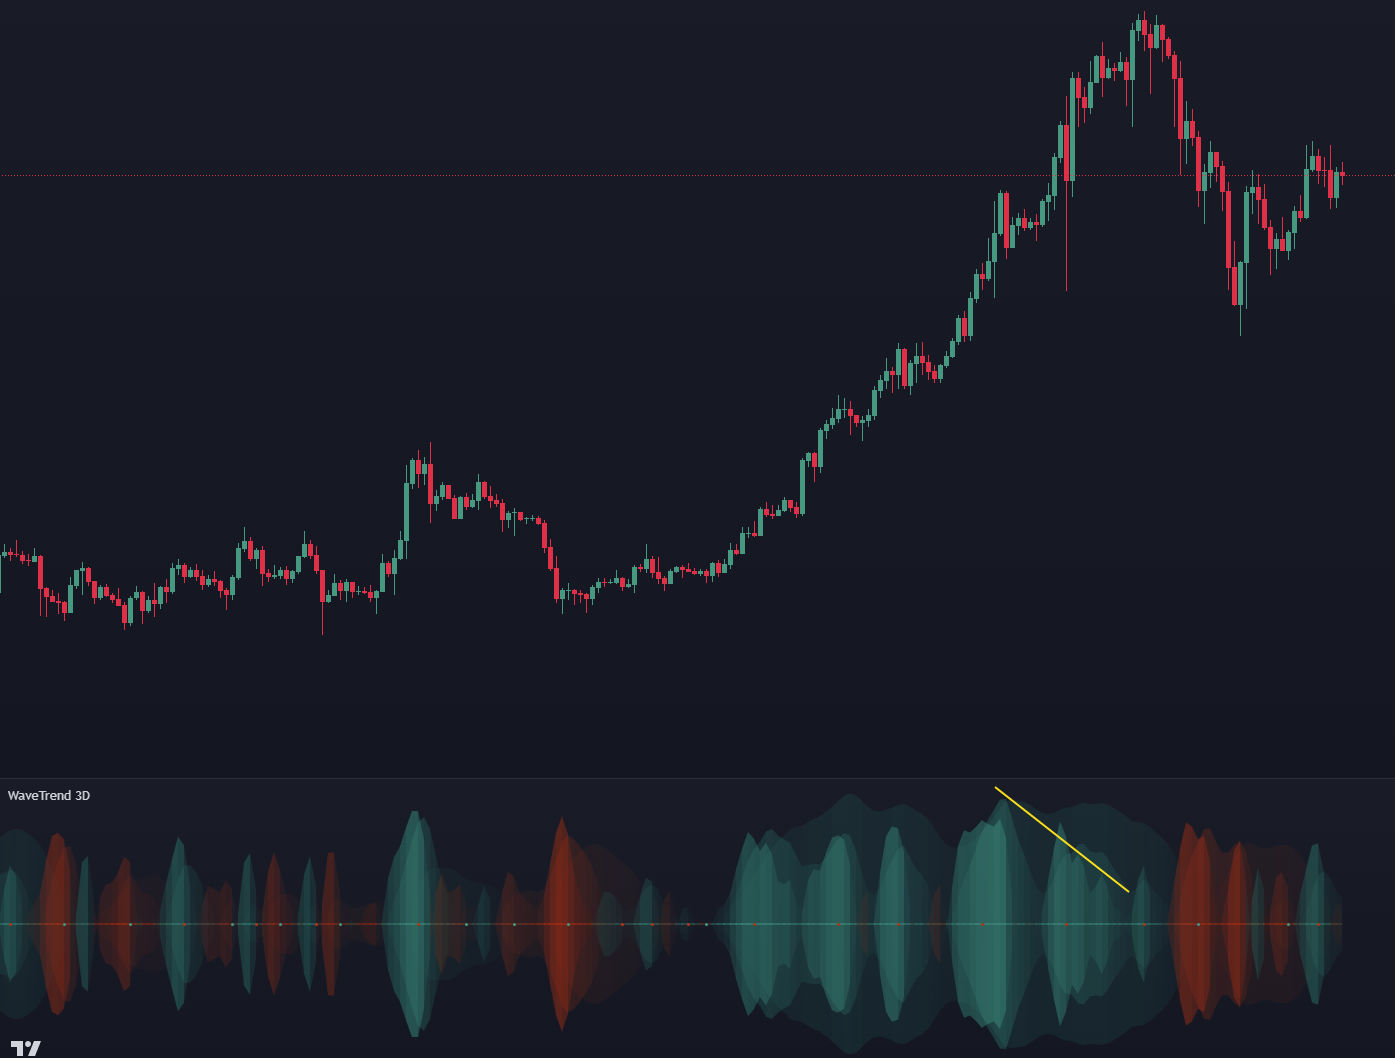
Divergence detection can also become clearer in mirrored space.
 |
|---|
| Fig 7: A smaller mirrored wave relative to its predecessor often signals an upcoming reversal. |
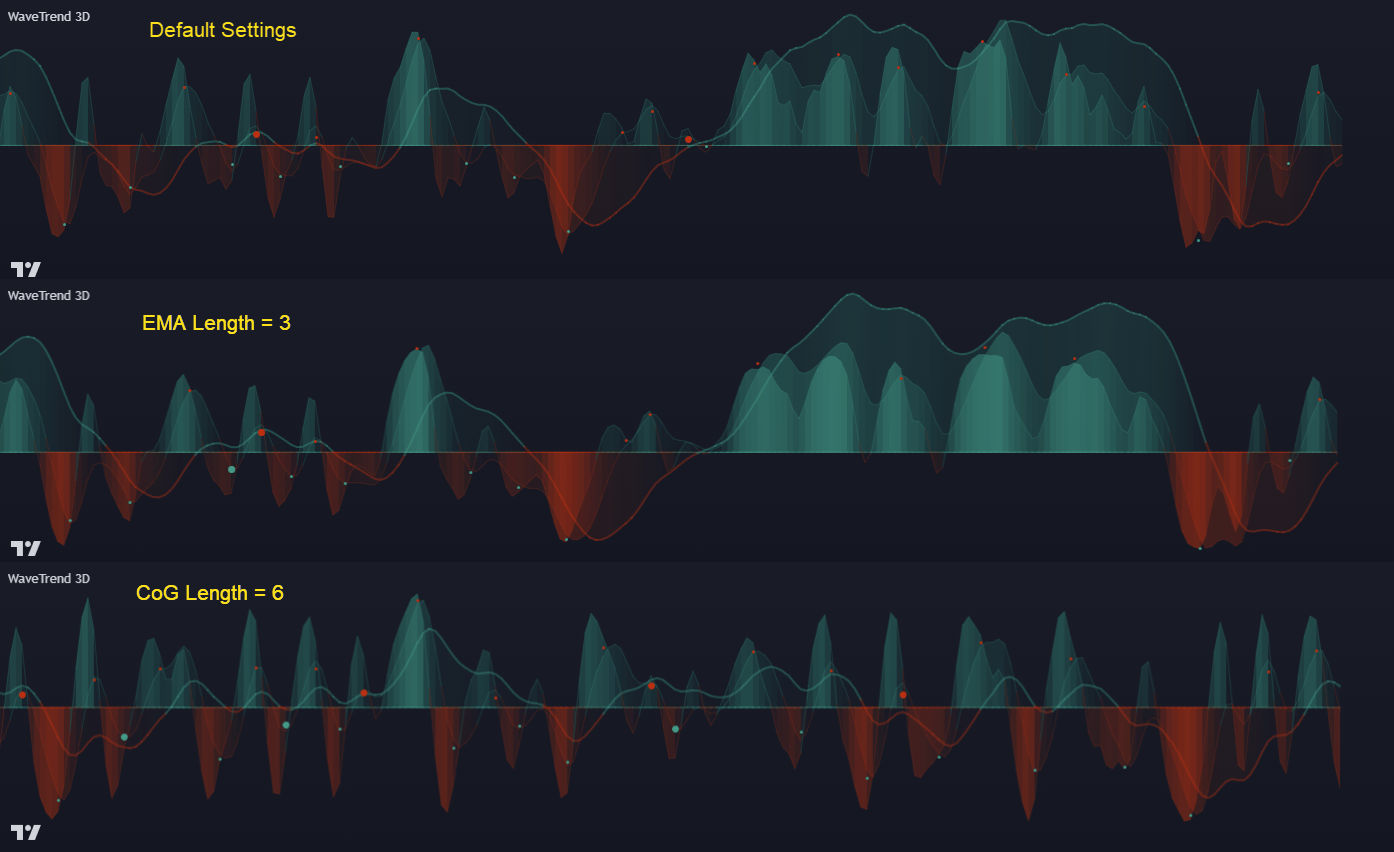
EMA & CoG Smoothing
Exponential Moving Average (EMA)
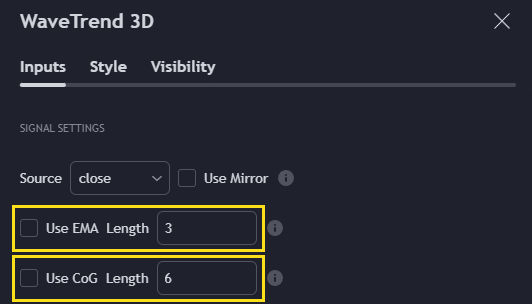
By default, Wavetrend 3D has optional EMA smoothing. Increasing the EMA Length offers stronger noise reduction, at the cost of slight delay.
 |
|---|
| Fig 8: Adjusting EMA length to smooth the oscillators further. |
Center of Gravity (CoG)
CoG is a zero-lag, adaptive smoothing method. Its drastic look can often highlight inflection points earlier.
 |
|---|
| Fig 9: CoG smoothing giving a different waveform shape compared to EMA. |
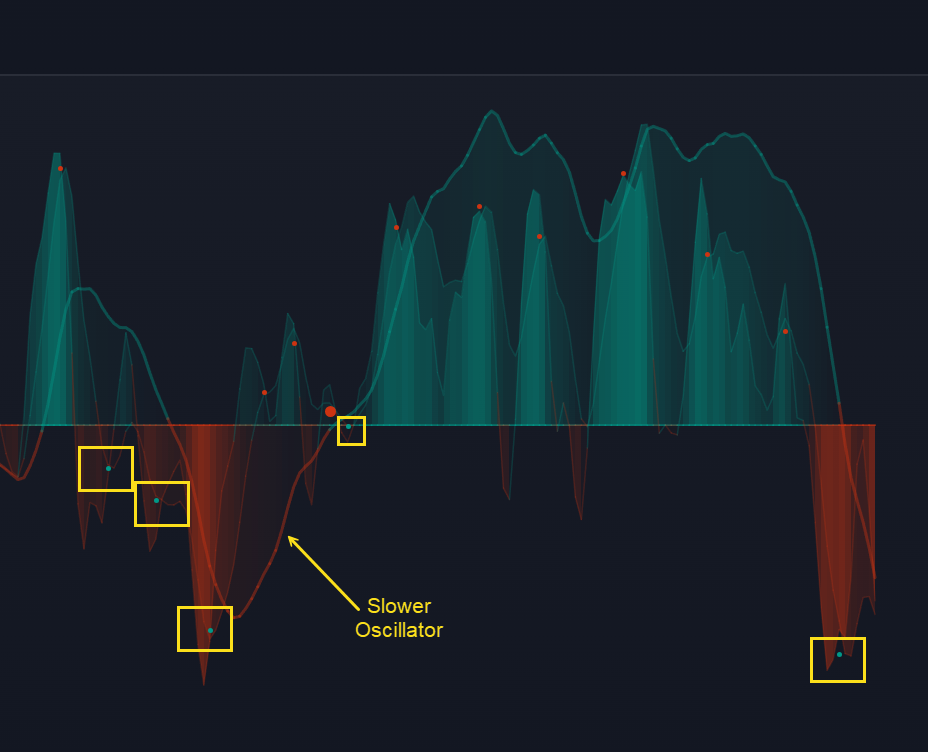
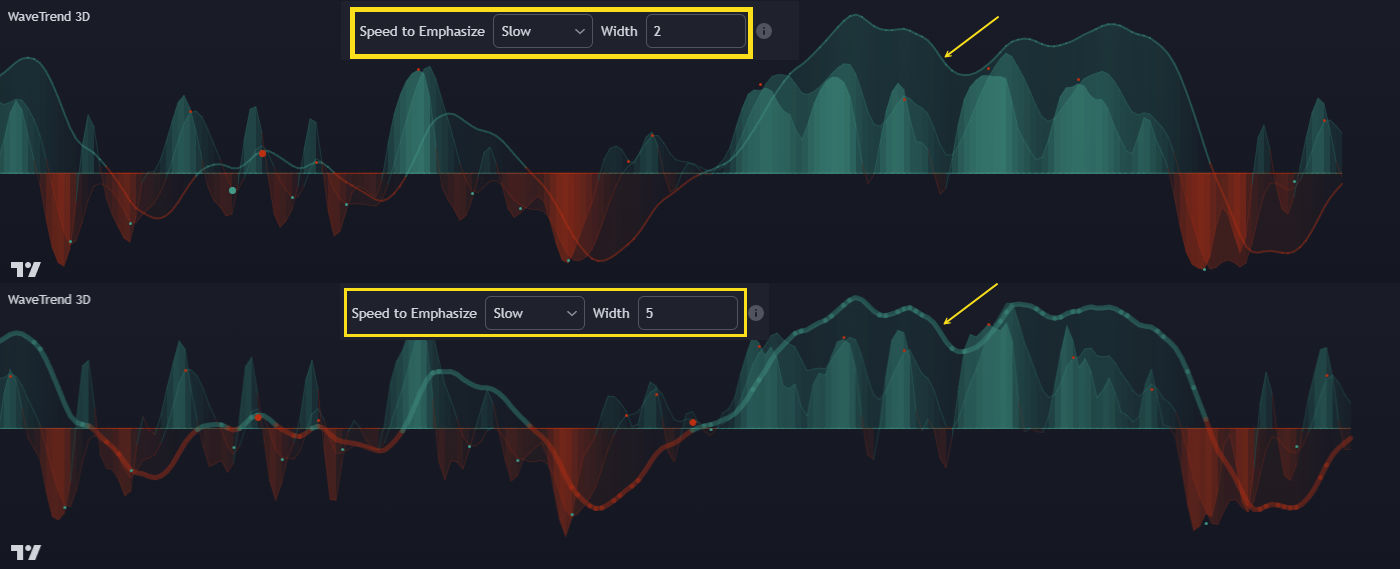
Speed to Emphasize
Select which oscillator (fast, normal, or slow) to emphasize. You can bold it or adjust the width for visual clarity.
 |
|---|
| Fig 10: Emphasizing the slow oscillator to spot major regime shifts. |
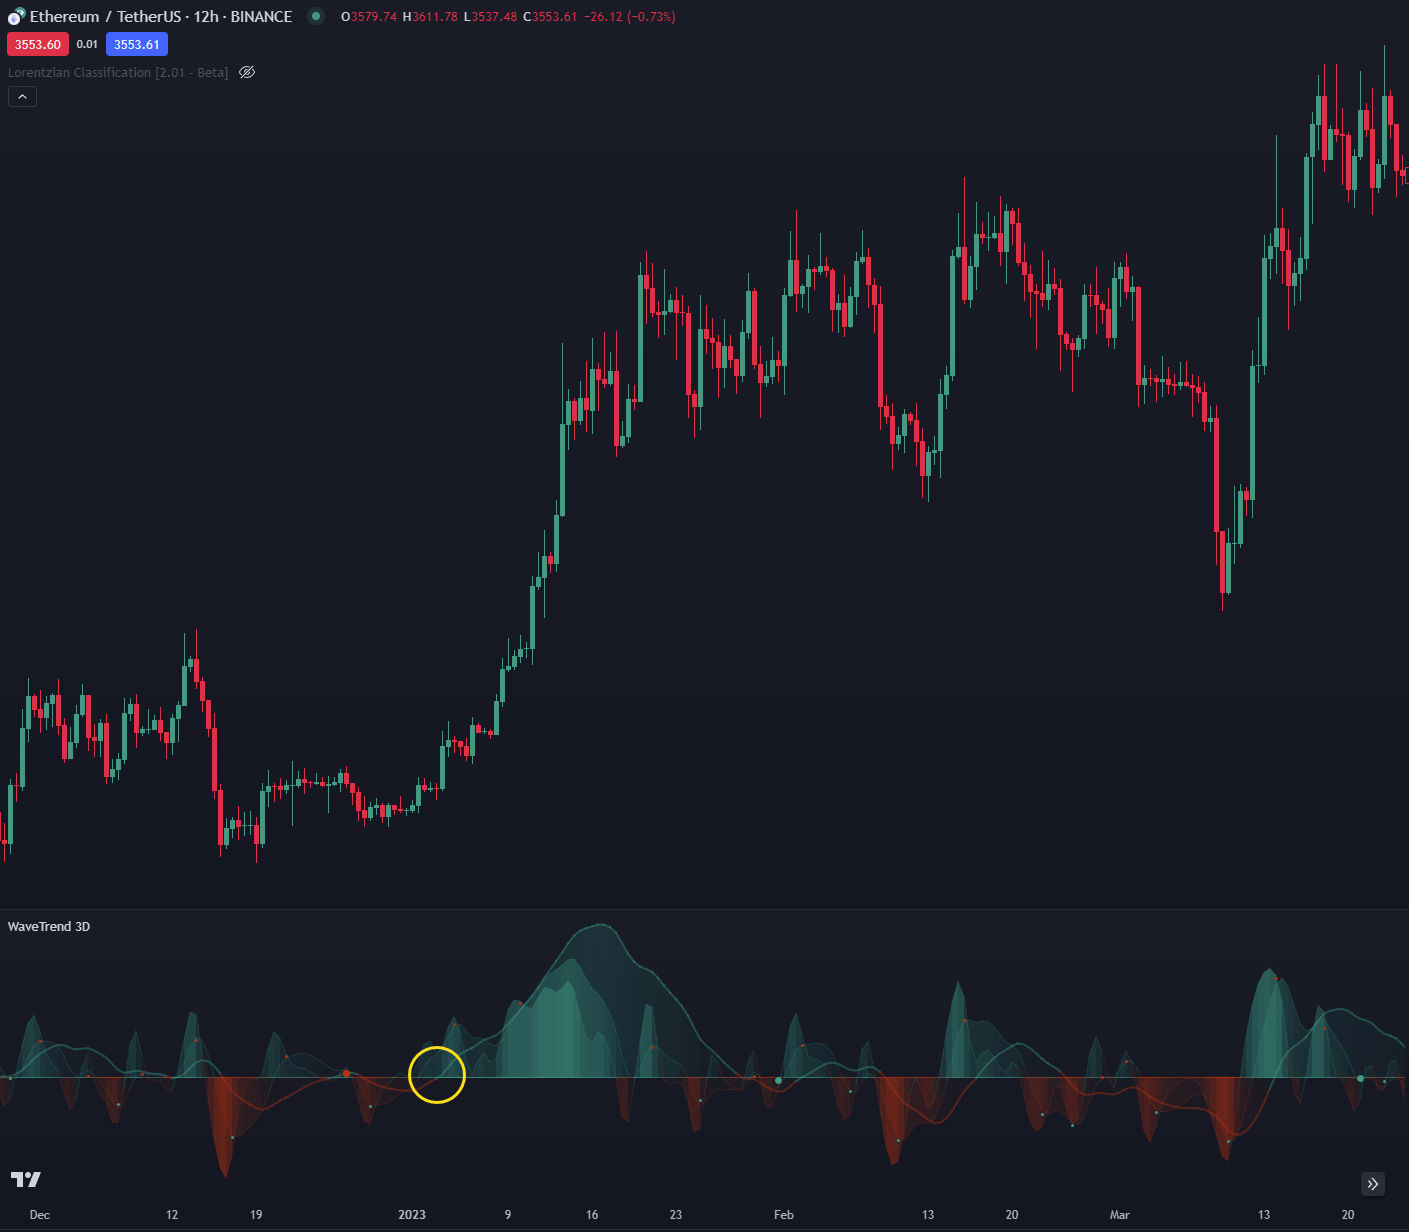
Crossing the zero line on the slow oscillator can signal a strong trend change.
 |
|---|
| Fig 11: Slow oscillator zero-cross events typically mark significant shifts. |
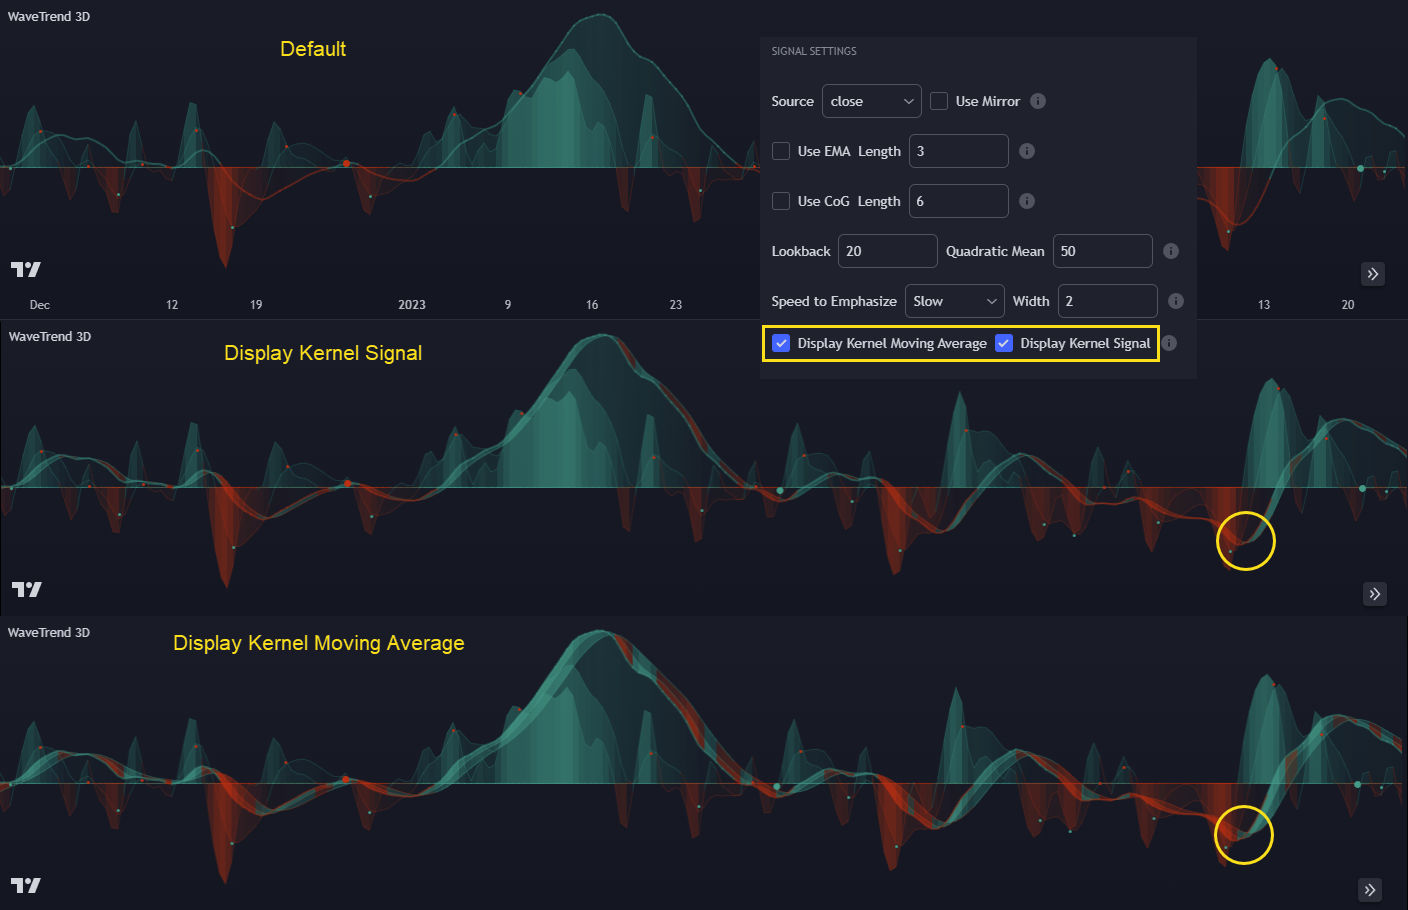
Kernel Estimators
Kernel estimators—particularly Display Kernel Moving Average or Display Kernel Signal—help detect trend bias with minimal lag.
 |
|---|
| Fig 12: A kernel ribbon changing colors can signal volatility spikes or market indecision. |
Frequent color changes often correlate with a ranging market.
 |
|---|
| Fig 13: Rapid color shifts generally indicate sideways, choppy price action. |
Overbought & Oversold Zones
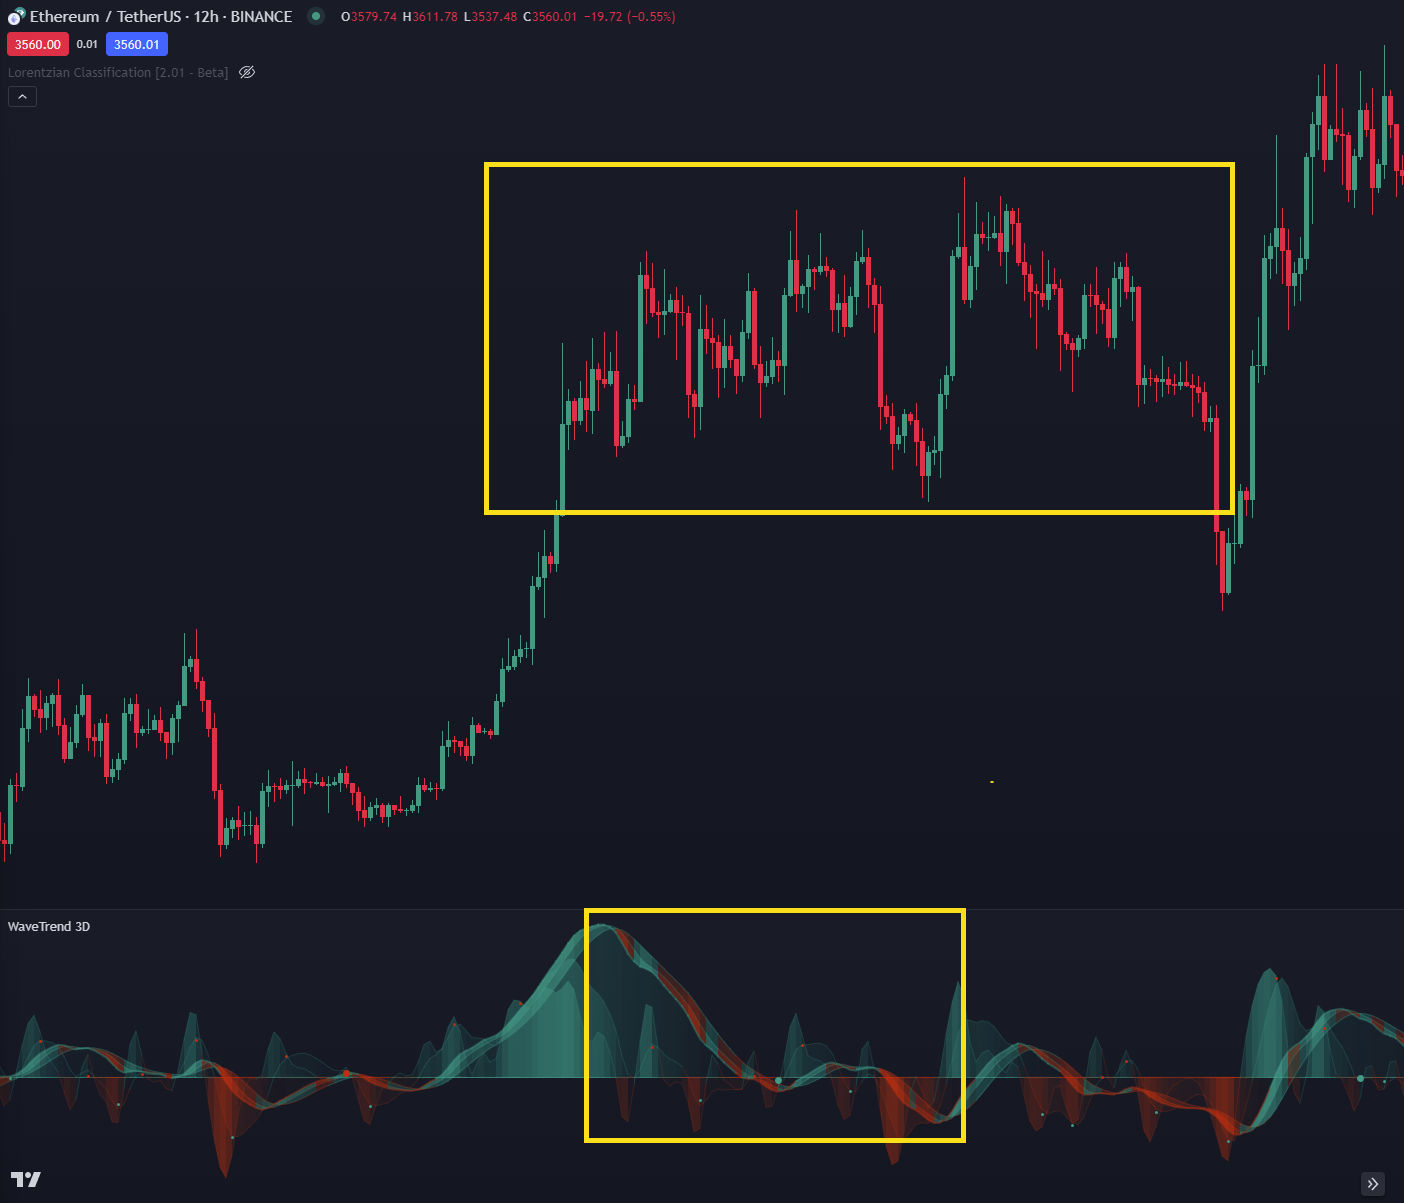
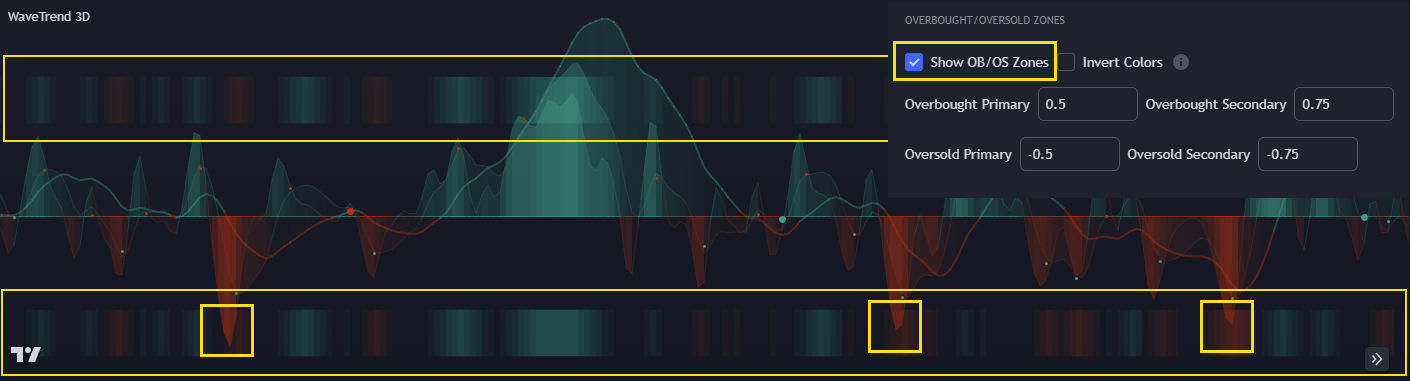
Since Wavetrend 3D’s oscillators map between -1 and +1, zones around ±0.5 highlight extremes occurring in < 25% of conditions. These aren’t guaranteed “sell” or “buy” triggers—especially if the market transitions to a strong trend—but they’re valuable reversal zones.
 |
|---|
| Fig 14: Overbought/oversold thresholds mapped at ±0.5 within a -1 to +1 scale. |
Practical Applications
- Trend Reversals: Watch the slow oscillator crossing zero.
- Multi-Timeframe Confirmation: Align small, normal, and slow oscillators for stronger signals.
- Divergences: Large circle signals often front-run powerful reversals.
- Mirrored Mode Insights: Identify smaller bullish or bearish “bubbles” inside a larger opposing wave.
- Risk Management: Combine Wavetrend 3D with other analysis forms; trailing stop-losses can be keyed to major oscillator pivot points.