Wavetrend 3D
This comprehensive guide will introduce you to the Wavetrend 3D indicator—a multi-timeframe, three-dimensional approach for analyzing market trends, inflection points, and potential trading opportunities. You'll learn why this enhanced version goes beyond the classic WaveTrend approach, and how its modern signal-processing techniques help provide deeper insight into market transitions.
Introduction
The Wavetrend 3D indicator is an advanced reimagining of the classic WaveTrend, integrating multiple timeframes (or “dimensions”) into a single view. By default, most indicators analyze one timeframe at a time, which can miss crucial “bigger picture” context when the market transitions from ranging to trending states. Wavetrend 3D aims to close this gap by using advanced filtering (e.g., Butterworth filters) and hyperbolic tangent normalization to highlight market cycles and potential triggers across multiple frequencies.
 |
|---|
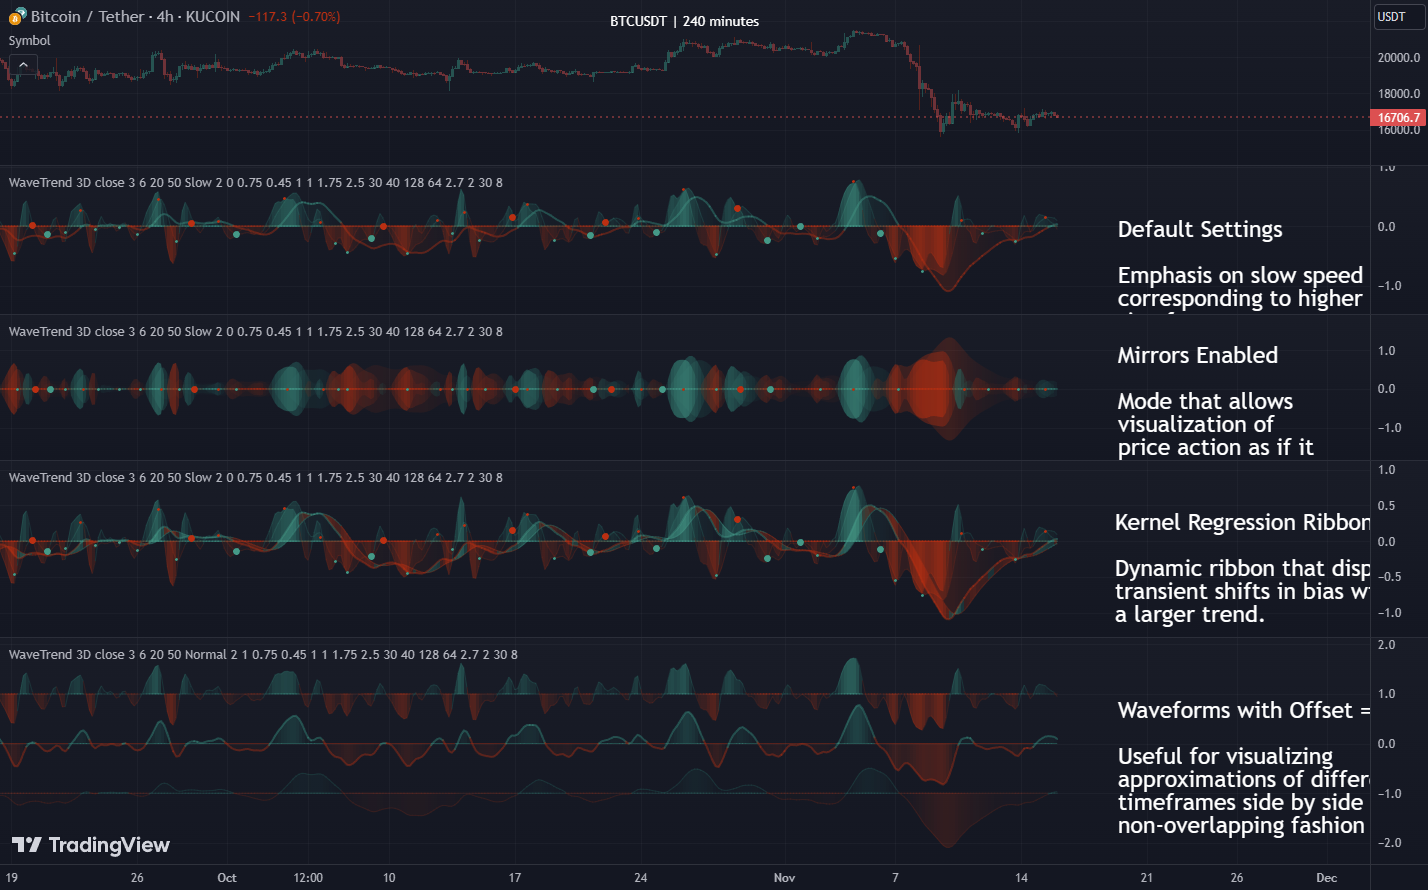
| Fig 1: A high-level look at Wavetrend 3D’s layered oscillators. |
Why This Matters
Traditional WaveTrend indicators provide valuable signals based on overbought/oversold zones and divergences. However, they can become less reliable during sudden regime shifts. Wavetrend 3D tackles these weaknesses by:
- Capturing multi-timeframe alignment: Shows how smaller oscillations (e.g., 6-hour) interact with larger ones (e.g., daily).
- Reducing whipsaw confusion: Emphasizes trend continuity over quick reversals.
- Offering new visual modes: Such as mirrored mode, enabling traders to interpret bullish vs. bearish currents more intuitively.
WaveTrend Classic, made popular on platforms like TradingView, ThinkorSwim, and MetaTrader, originated from AIQ Systems in the 1980s under the name “Trading Channel Index (TCI).” Over time, it became a go-to tool for detecting overbought/oversold levels and divergences. Wavetrend 3D builds on this legacy with modern filtering and multi-timeframe synchronization.
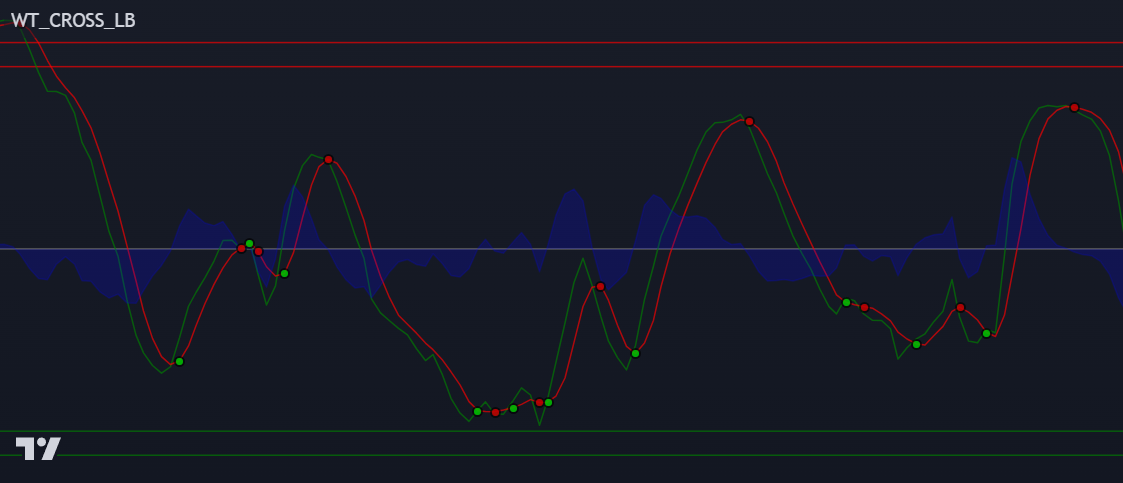 |
|---|
| Fig 2: Original WaveTrend (Classic) approach, popularized since the 1980s. |
How Wavetrend 3D Works
At its core, Wavetrend 3D applies modern signal-processing techniques:
- 3D Visualization: It plots a “fast,” “normal,” and “slow” oscillator. Each captures a different timeframe perspective, effectively compressing multi-timeframe analysis into one chart.
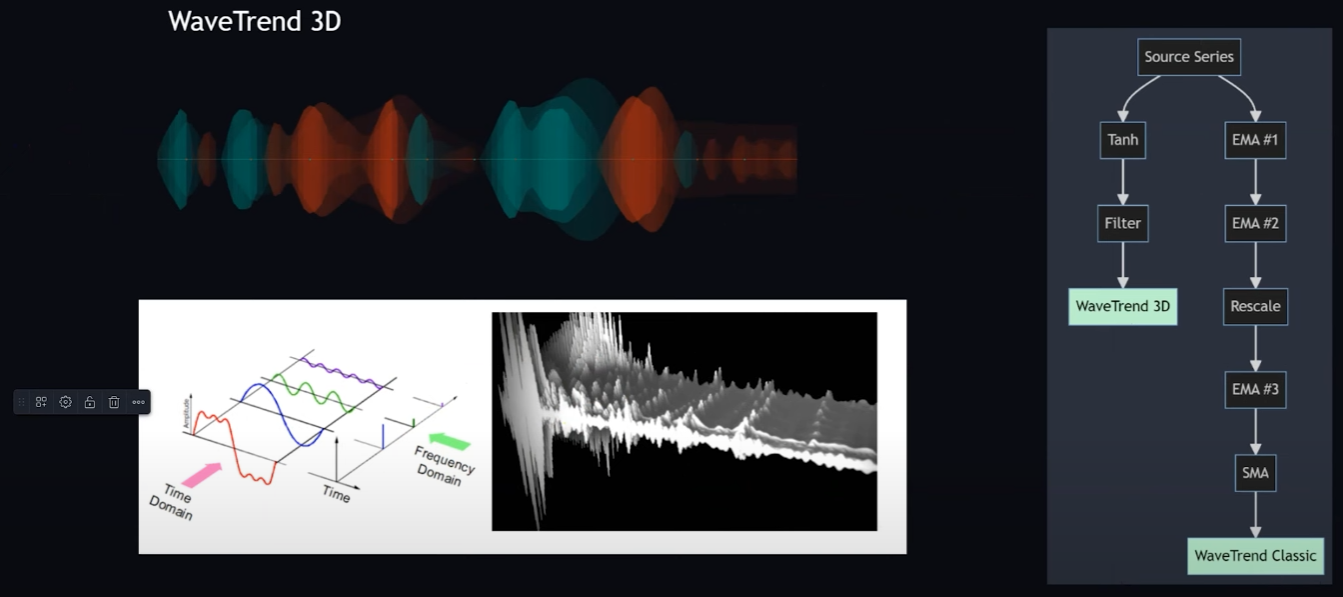 |
|---|
| Fig 3: Conceptual visualization of multi-frequency oscillators in a "3D" wave. |
- Noise Reduction: A Butterworth filter and optional smoothing methods (e.g., EMA or CoG) reduce lag while retaining critical signal structure.
- Trigger Circles: “Small circles” appear when the fast and normal oscillators cross, while “big circles” identify potential “trigger wave” divergences—often early signals of major price momentum.
What This Means for Traders
By viewing market data in three dimensions, traders can:
- Spot multi-timeframe confluence: Identify moments when short- and long-term oscillators align, often signaling stronger potential moves.
- Track regime shifts: Watch how the slow oscillator crosses its zero line, a key pivot that often implies a trend change.
- Adapt to extremes: Overbought/oversold boundaries tailored to Wavetrend 3D’s normalized scale offer more nuanced alerts.
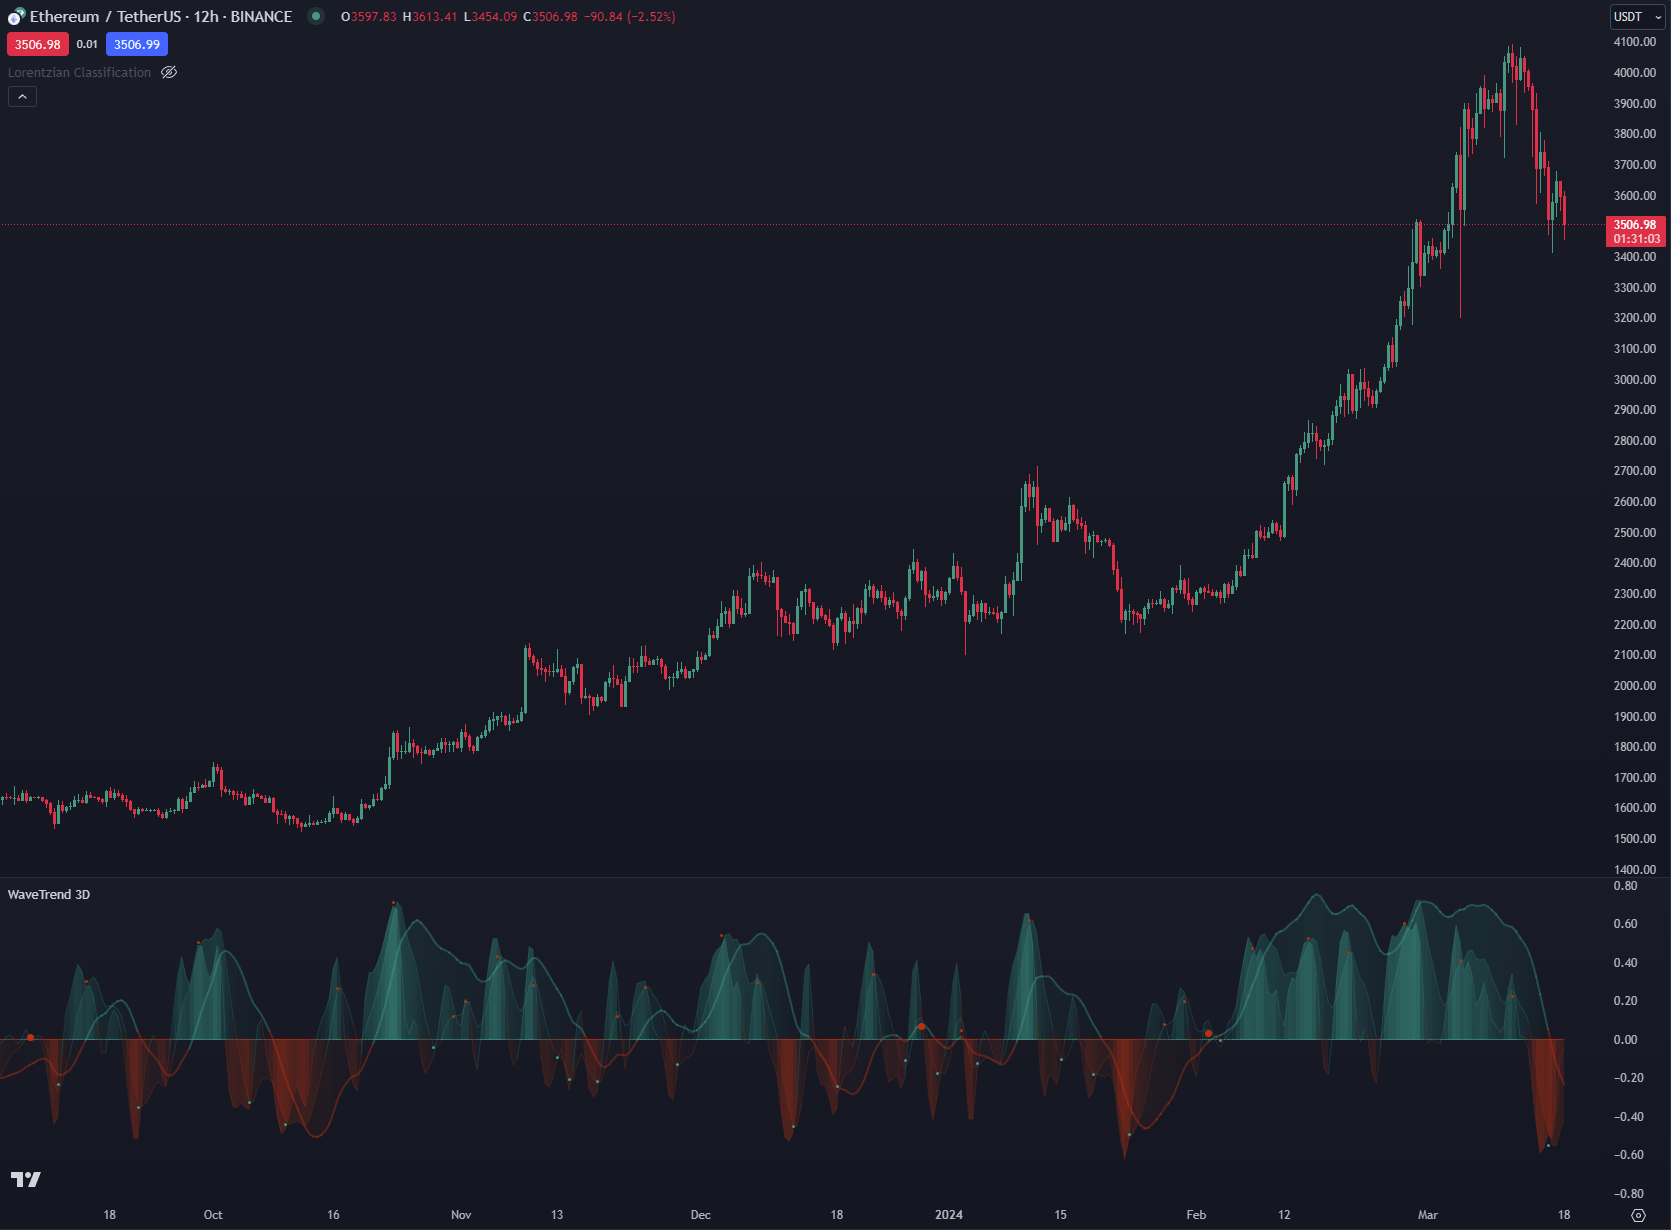 |
|---|
| Fig 4: Wavetrend 3D overlaid on multiple timeframes for Ethereum (6h, 12h, 24h). |
What This Guide Covers
In the pages that follow, you’ll learn:
- Core Concepts of Wavetrend 3D: A deep dive into oscillators, small vs. big circle signals, mirrored mode, and smoothing options.
- Practical Use Cases: How to interpret circle signals, watch for divergences, and adapt settings like EMA or CoG.
- Advanced Features: Discover kernel estimators, zero-lag smoothing, and how to leverage overbought/oversold zones in a 3D context.