Adjust Lorentzian Classification Kernel Smoothing
Lorentzian Classification uses Nadaraya–Watson kernel regression to estimate a smoothed price from weighted observations. These controls change the weights, the visible estimate, and the conditions that use it. Kernel regression is a separate calculation from the classifier's neighbor vote.
Interactive Settings Explorer
Use the information buttons to explore the Premium settings. This documentation sandbox does not run kernel regression, save a preset, or change TradingView. Read the active defaults from your installed version.
Documentation example. Changes stay on this page and do not update TradingView or calculate signals. Check your installed version for current labels, defaults, and available controls.
⚙️ KERNEL SETTINGS
Kernel Settings Help
Core Concepts
For the Rational Quadratic kernel, an observation i bars back receives weight:
w(i) =
  (1 + i² / (2 × r × h²))^(−r)

estimate =
  sum(price[i] × w(i)) / sum(w(i))
i is the observation's age in chart bars, price[i] is the selected source at that age, and w(i) is its weight. h is the lookback scale, set by Lookback Window, and r is set by Relative Weighting; both must be positive for this interpretation. The lookback scale affects the weights, not how many observations the sum includes. Regression Level sets that sampling extent: in Premium v3.1, the sum covers the latest Regression Level + 2 bars, so a level of 25 uses 27 bars. See the public kernel library.
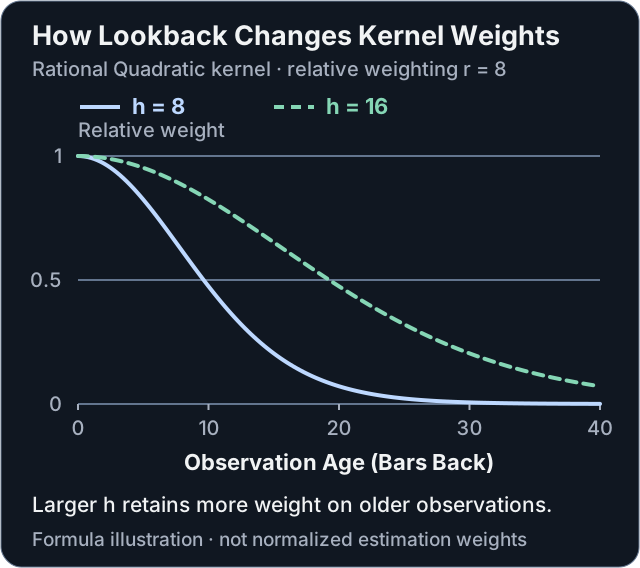
Calculated illustration of the displayed formula, with r = 8 and weight at age zero set to one. These are unnormalized weights, not a return forecast. The implementation's finite sampling extent also affects the final estimate.
Configuration Parameters
| Setting | Effect |
|---|---|
| Trade with Kernel | Applies kernel-direction conditions to signals. It does not replace the classifier with a moving-average strategy. |
| Show Kernel Estimate | Shows or hides the estimate; visibility and filtering are separate controls. |
| Enhance Kernel Smoothing | Uses comparisons between kernel estimates to determine direction or color changes. Check its interaction with dynamic exits. |
| Lookback Window | Changes the distance scale in the weighting function. A larger scale spreads influence across history. |
| Relative Weighting | Changes the Rational Quadratic weight shape. As it grows, the weights approach a Gaussian kernel at the same scale. |
| Regression Level | Affects the kernel's sampling extent in the implementation. It is not a detector that removes anomalous early prices. |
| Lag | Alters the comparison kernel used for crossover detection. It is not a timer that always waits that many bars before issuing an alert. |
| Enable Custom Mean Reversion Alerts | Participates in displaying the custom deviation dots in Premium v3.1. Creating a running notification still requires a TradingView alert. |
| Alert Threshold (ATR) | Sets the custom deviation threshold in multiples of Average True Range (ATR). It is not a probability or a price target. |
| ATR Period | Sets the ATR length used to scale the custom kernel-distance calculation. |
| Show Deviation Markers | Shows optional dots above or below price when the custom distance condition is met and Enable Custom Mean Reversion Alerts is enabled. |
In AI Edge Optimizer, Enhance Kernel Smoothing is called Use Kernel Smoothing. Both names refer to the same setting.
These distance controls belong to Kernel Settings in Premium v3.1. Their dots are separate from the standard mean-reversion symbols controlled by Show Mean Reversions in Display Settings. Select the intended condition when creating an alert; a display checkbox is not a running TradingView notification.
Check the Exit Mode
Exit compatibility depends on the script version. In Premium v3.1, enabling enhanced kernel smoothing forces strict four-bar exits, even when Use Dynamic Exits is on. Verify the active mode and the alert conditions in your installed version before comparing results.
Hiding Show Kernel Estimate does not turn off Trade with Kernel. To investigate whether the kernel is gating entries, change the filtering control deliberately and keep the visual line available for comparison.
A Useful Experiment
Keep the chart, feature inputs, and filters fixed. Compare the default estimate with a modestly larger lookback scale. Inspect changes in turns, color transitions, and signal timing, then restore the baseline before adjusting relative weighting. Neither a smoother line nor fewer color changes proves a better strategy.
Use Display Settings for visual placement and Symbols and Alerts for event meanings.