Explore the Interactive Pine Script Demo
The AI Edge homepage lab lets you change a strategy’s inputs and watch its chart and tested results update together. Open the homepage lab, under One backtest is not enough. You can try a small Pine Script® strategy there without creating an account.
The lab uses historical Bitcoin data and runs the strategy in your browser on your own device. Use it to learn how input values affect a result. Continue in Studio when you want to edit other scripts, load your own data or run optimization studies.
Select any image on this page to open it at full size.
See the Starting Strategy
The lab prepares and runs the example by itself when you scroll to it. You do not need to start it. The sliders and Parameter space become available when the example is ready.
The example uses two simple moving averages, a fast one and a slow one:
- When the fast average is above the slow average, the strategy enters a long position.
- At any other time, it closes that position.
- During a warmup period of 150 bars at the start of the data, it does not trade.
The lab has two views. Use the two buttons at the top of the lab to switch between them:
- Parameter space is the view the lab opens in. It shows a surface of tested results together with the Bitcoin chart.
- Chart shows the Bitcoin chart alone.
The status line at the bottom of the lab reads Computed on your device when the result on screen is up to date. While the lab recalculates, it reads Compiling and updating results….
Change One Input
A configuration is one pair of values: one fast length and one slow length. To change the configuration:
- Move Fast length and watch the result. With a keyboard, focus the slider and press the arrow keys.
- Move Slow length in the same way.
- Watch three things update together: the moving-average lines, the Long and Exit markers on the chart, and the Hypothetical return figure.
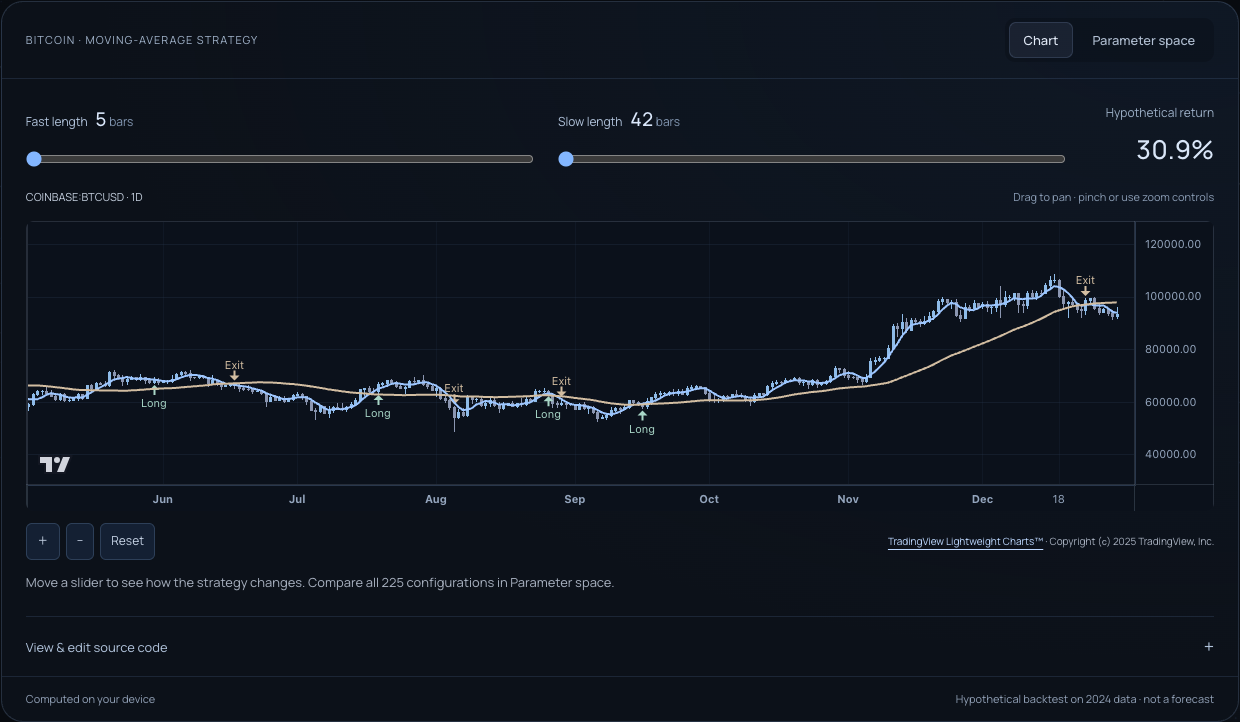
Choose Chart to focus on the price chart. This capture from October 23, 2026 uses Fast length 5 and Slow length 42, which give a 30.9% hypothetical return under the example's assumptions. These are example values, not recommended settings.
When you change an input, the chart stays at the same dates and zoom level. Drag the chart to pan. Use the + and − buttons below the chart to zoom, and Reset to return to the starting range.
Explore the Parameter Surface
The lab tests all 225 configurations by itself, then draws the results as a surface in Parameter space. While it works, it shows a count such as Exploring 45 of 225 configurations…. If you see Build parameter surface instead, choose it. If you switched to Chart, choose Parameter space to return to the surface.
In the default example, the lab tests fifteen fast lengths (5 to 33, in steps of 2) with fifteen slow lengths (42 to 112, in steps of 5). Each point on the surface is one configuration. The height of the point is the historical return of that configuration.
- To select a configuration, hover over the surface or tap it. The sliders and the chart update to match.
- To rotate the surface, drag it. Reset view, below the surface, restores the starting view.
- For exact values, or to use the keyboard, use the same two sliders.
If the lab shows 3D unavailable, it draws a simpler surface instead. The sliders still reach every configuration.
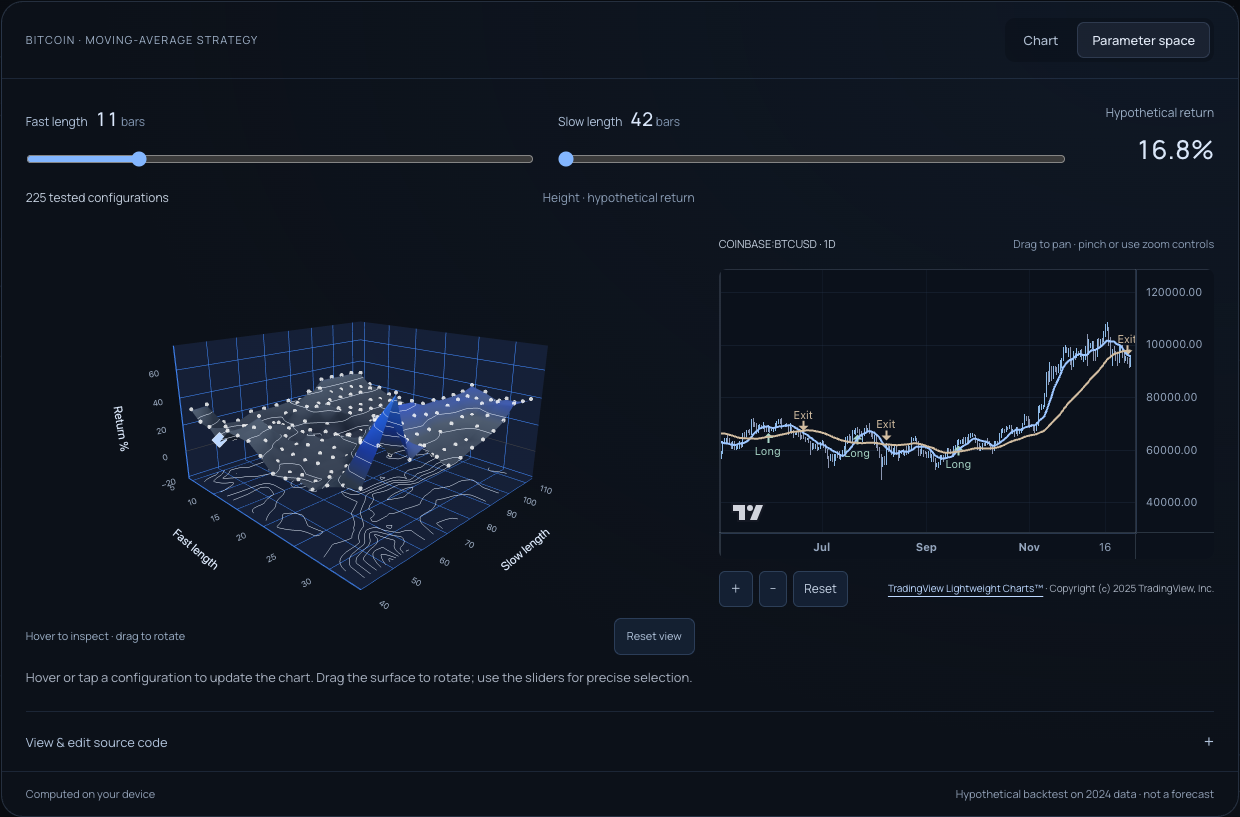
Choose Parameter space to compare all 225 tested configurations. This capture from October 23, 2026 uses the same data and strategy as the first image, with Fast length 11 in place of 5. The sliders, the selected point and the chart show the same configuration. The height of each point is its historical return. The faces between points only join them: they do not show the probability of a future return.
Look for sensitivity: does a small move across the surface cause a large change in the result?
- A single high point with lower points around it can mean the result depends on exact values.
- A wider area of similar heights can mean small changes to the inputs matter less.
Neither one establishes future performance.
The lab can test every combination because its grid is small. A study in the Optimizer can use a sampled search instead, which tests only some of the combinations.
Edit the Script
Editing is optional. To read or change the script, open View & edit source code, below the chart.
- Edit the script, then pause. The lab compiles and runs your edit by itself after a brief pause in typing.
- Watch the status line at the bottom of the lab. It reads Waiting for your edits…, then Compiling and updating results…, then Computed on your device.
- If a compiler message appears in the status line instead, read it and correct the script before you continue.
In Parameter space, the lab then tests all 225 configurations again with your script.
The Fast length and Slow length sliders control inputs with matching names. To keep this comparison working, your script must include:
- A
strategy()declaration. Without it, the status line reads Keep a strategy() declaration to compare historical returns. - Two whole-number inputs titled
Fast lengthandSlow length. Without them, the status line reads Keep the integer inputs "Fast length" and "Slow length" to explore this two-parameter study.
The editor accepts up to 8,000 characters. The chart draws up to eight plots from your script.
Understand the Example's Assumptions
The default example makes these assumptions:
| Assumption | Value |
|---|---|
| Data | Coinbase BTC/USD daily prices from 2024 (366 bars) |
| Starting equity | $10,000 |
| Positions | Long/flat: the strategy holds a long position or no position |
| Position size | 100% of equity |
| Commission | 0.1% on each entry and exit |
| Fills | At the next bar's open |
| Warmup | 150 bars |
| Slippage | None |
| Positions still open at the end | Valued at the final close |
| Volume | Not available in the data snapshot, so the lab supplies zero |
The lab does not show all of these assumptions. On screen you see:
- the source and timeframe above the chart: COINBASE:BTCUSD · 1D
- the status line and Hypothetical backtest on 2024 data · not a forecast in the footer.
The table describes the starting script. If you edit the script, the lab runs your version on the same data and the same 225 configurations. Download the sample data to inspect it.
Continue in Studio
Before continuing, check that you can select a configuration, identify its fast and slow lengths, and explain why the chart and return change together. The surface compares historical tests under shared assumptions; it does not pick a suitable strategy for you.
Start free in Studio, then follow Your First Study. That tutorial uses a different script — ADX Regime Trend — on a different daily Bitcoin sample to teach the full Studio and study workflow. It is not a continuation of the homepage lab's moving-average return.
Below the lab, three links lead onward: Open Studio, Follow the first-study guide and See where to start.
Connecting your own AI assistant over Model Context Protocol (MCP) comes with the Max plan. During the beta, an AI Edge administrator also has to add your account. To take part, email business@ai-edge.io. Check what you need before connecting.
The homepage lab runs this comparison on your device. It does not create a study that is tied to an account, and it does not keep your edits: when you reload the page, the starting script returns. Studio studies are different: they have their own rules for what is stored and what is uploaded. Before you use private scripts or data in Studio, read what is stored and sent.