Run Your First Pine Script Optimization Study
By the end, you will have a saved script, a named Settings configuration, a five-trial study and a trial you can reopen in Studio. This exercise uses sample data to teach the steps. The sample is not a proven trading strategy.
Before You Start
Keep this guide in one browser tab and Studio in another. Switch back to the app after each step. You can select any screenshot to enlarge it.
You will open a ready-made example, then test five sets of its values. You do not need to write your own script. If a term is unfamiliar: a script is the Pine Script® code in the editor, Settings supplies its input values, a study is a search for better Settings, and a trial tests one set of values within it.
Sign in and open AI Edge Studio, then select Editor under Studio in the sidebar. A Free account can run this compatible browser study without Optimizer credits. Keep this browser tab open and avoid reloading it during the run. You can navigate to other pages inside the app.
The screenshots follow the same ADX Regime Trend example on daily Bitcoin. Your sampled values and scores can differ. What is a script, study or trial?
Open a Script
- In a blank Studio tab, choose Browse Indicators & Strategies, search for ADX Regime Trend, and select the row. It is one of the curated samples that ship with Studio, so there is nothing to type or paste. If no blank tab is open, select + above the editor, then Samples…, and find the sample the same way. You can also press ⌘K (Ctrl+K) when the cursor is not in the code editor or another text box.
- Wait for Compiled in the status bar below the editor. Studio compiles and reruns the script after each edit. To run it again yourself, select the Compiled status to open Run Overview, then choose Run Again. With the cursor in the editor, Ctrl+Enter (⌘Enter on a Mac) does the same.
- Compiled means Studio accepted the script. It has not started a study. If the chart is empty, choose data in the next section; the orange Trend line and the shaded regime background then appear over the price chart.
This example is a strategy(): it places simulated entry and exit orders, so those orders already carry its backtest signal. The editor says Signals: Strategy Orders above the source rather than offering a plot to designate. An indicator() has no orders, and Choose a Backtest Signal explains what to designate in that case.
For reference, this is the source Studio opens:
//@version=6
//@description Trades the trend only while ADX says a trend is actually present, and stands aside in directionless markets.
strategy("ADX Regime Trend", shorttitle="ADX Trend", overlay=true, initial_capital=100000, default_qty_type=strategy.percent_of_equity, default_qty_value=100, pyramiding=0, commission_type=strategy.commission.percent, commission_value=0.05, process_orders_on_close=true)

regimeGroup = "Regime"
trendGroup = "Trend"
adxLen = input.int(10, "ADX Length", minval=5, maxval=60, step=1, group=regimeGroup)
minAdx = input.float(15.00, "Minimum ADX", minval=5.0, maxval=45.0, step=0.5, group=regimeGroup)
trendLen = input.int(250, "Trend Length", minval=10, maxval=300, step=5, group=trendGroup)

[diPlus, diMinus, adxValue] = ta.dmi(adxLen, adxLen)
trend = ta.ema(close, trendLen)
strongUp = adxValue > minAdx and diPlus > diMinus and close > trend

if strongUp and strategy.position_size == 0
    strategy.entry("Long", strategy.long)
if close < trend and strategy.position_size > 0
    strategy.close("Long")

plot(trend, "Trend", color=color.new(#ff9800, 0), linewidth=2)
bgcolor(adxValue > minAdx ? color.new(#26a69a, 92) : color.new(#787b86, 94), title="Trend Strength")
Select the save icon () at the editor's top right, or press Ctrl+S (⌘S on a Mac). Check for Version 1 below the source. If you opened the sample in a blank tab, Version 1 may already show, because Studio can save a sample when it first compiles. Saving the unchanged source again does not add a version.
The editor tab shows the script's short title, ADX Trend. My Scripts lists the saved script under the sample's file name, adx_regime_trend. To rename it, select Browse Scripts under Editor in the sidebar, then use the row's rename control.
The save icon saves the script's source code only. You save its input values separately, in Load Data and Save Your Settings. Find the editor controls if you need a map.
From then on, Studio saves each edit that compiles as a new version. This walkthrough does not change the source, so the script stays at Version 1. If you edit it, the number goes up, and later steps show that number instead.
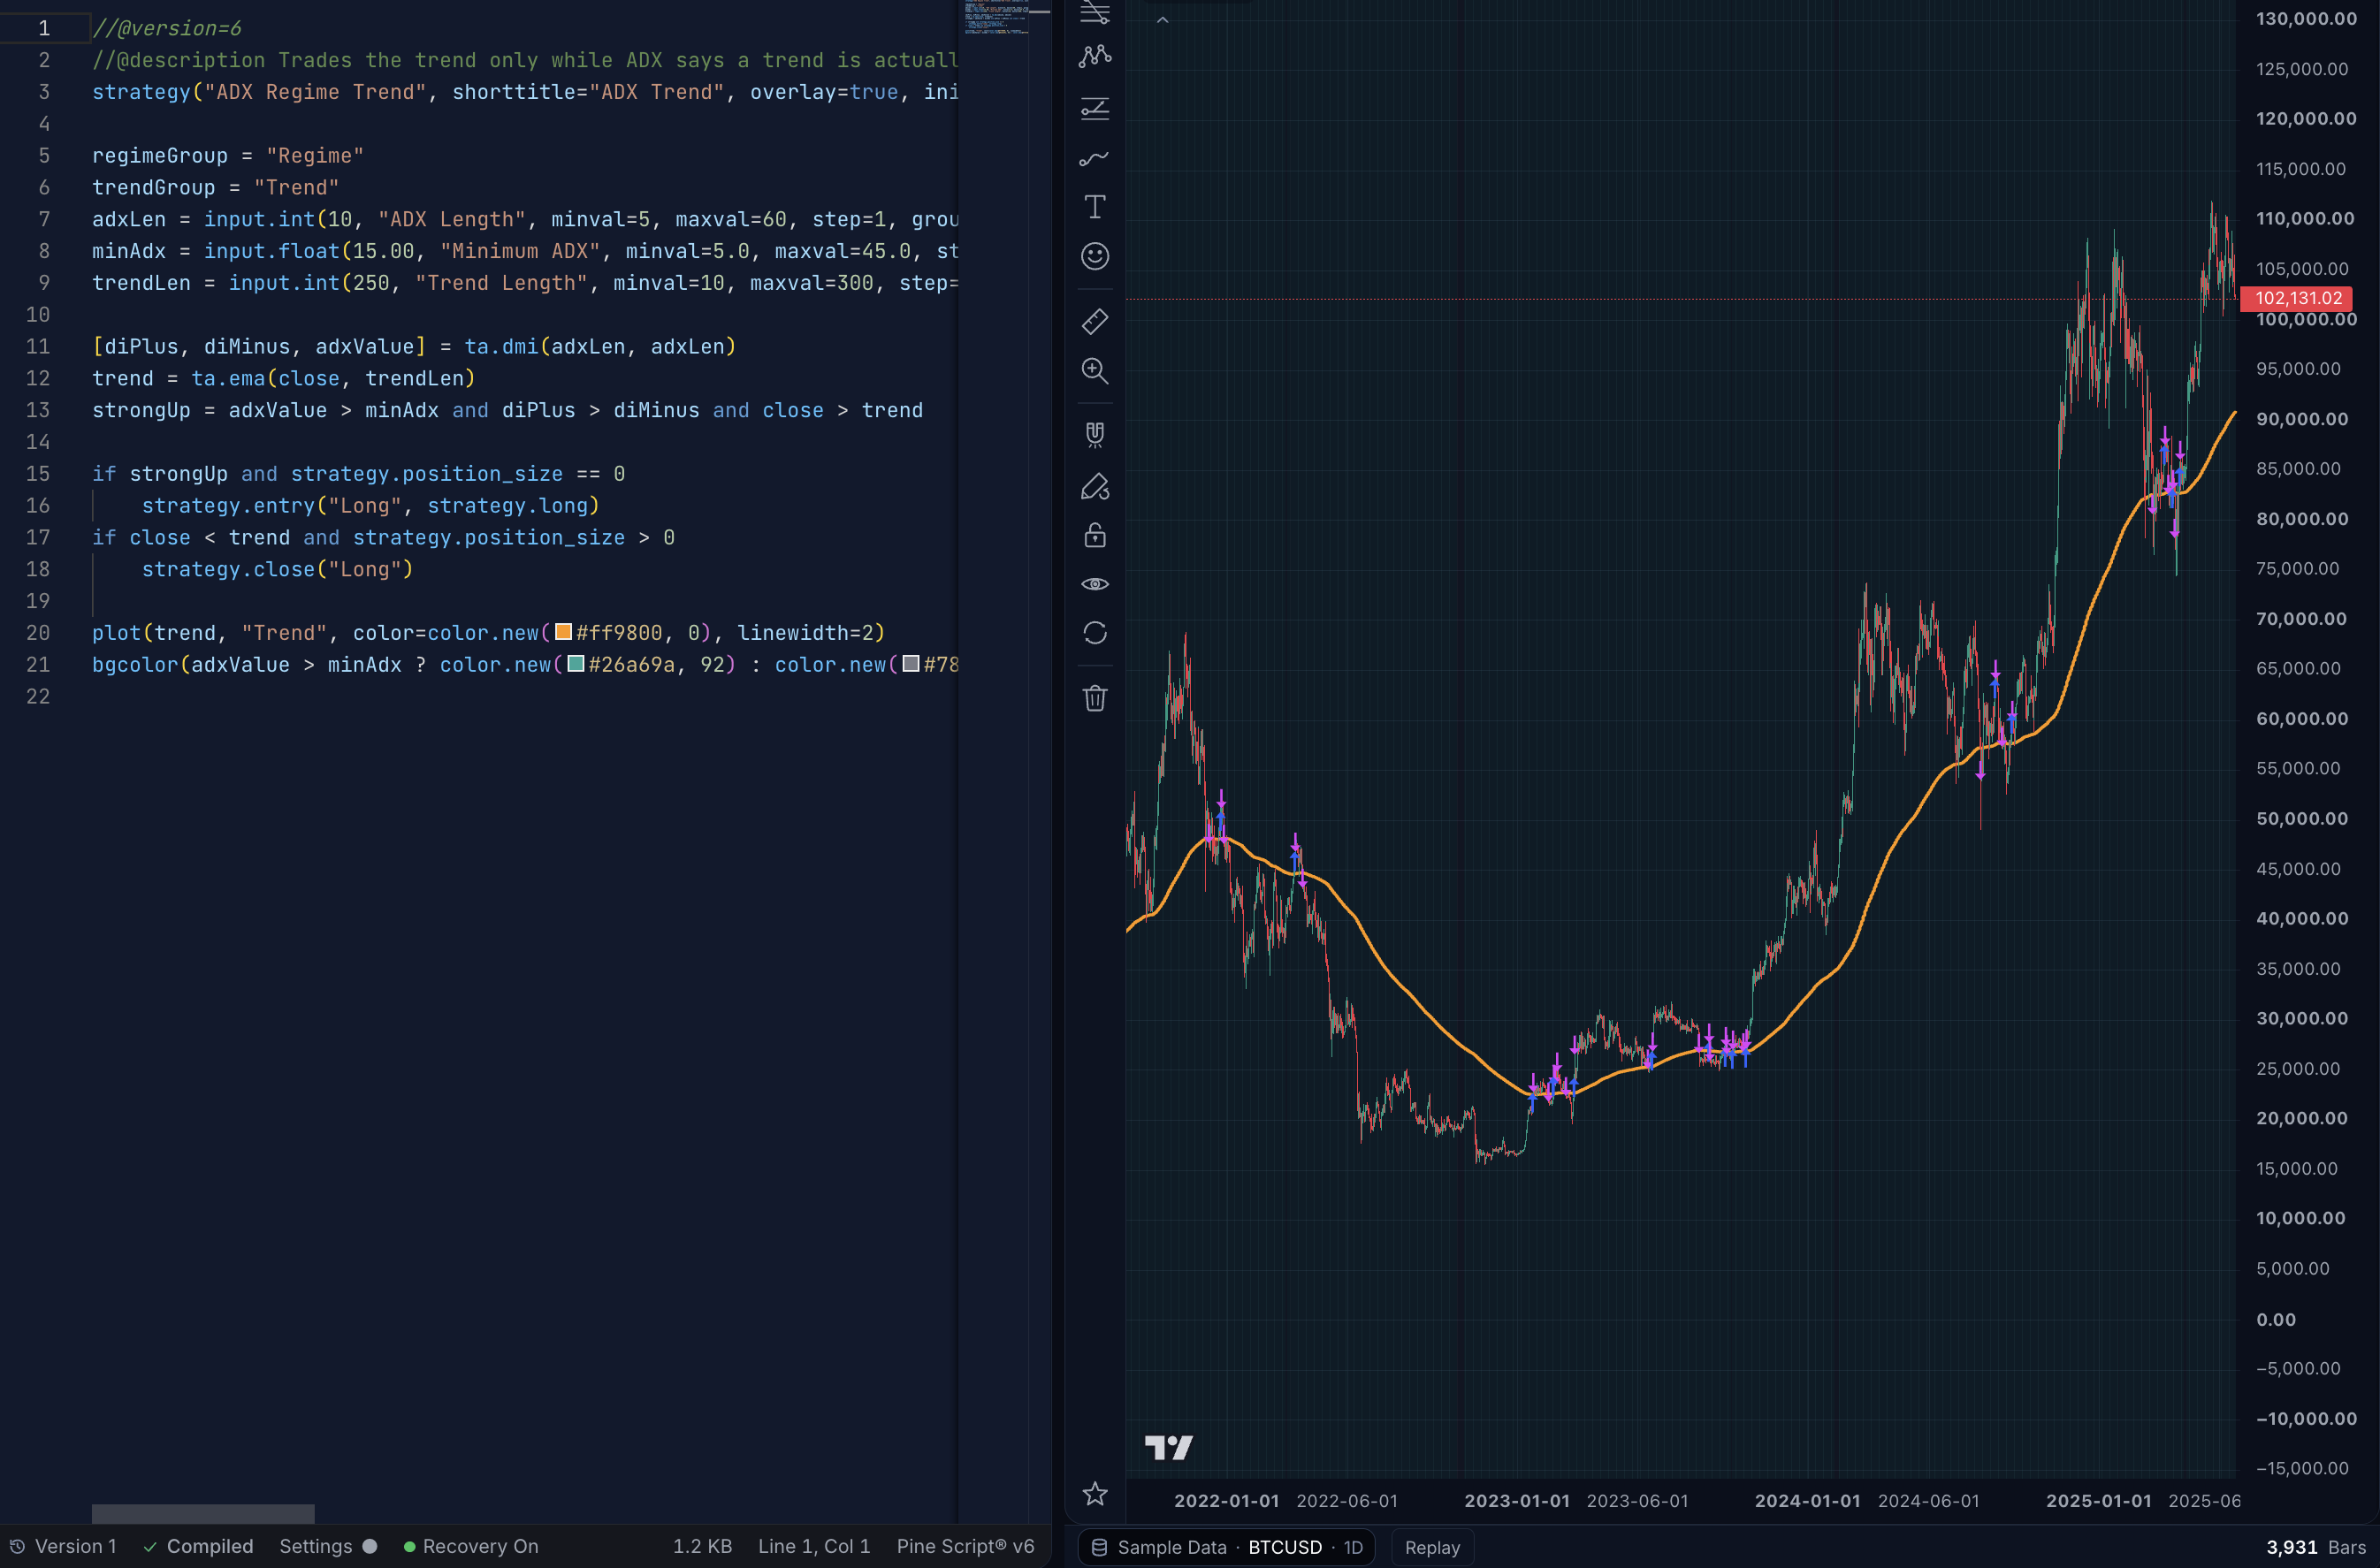
The script’s source code remains visible in the editor while the chart shows the result. The Settings button is in the editor’s bottom status bar, and the data button is at the chart’s bottom left. Select the image to open it at full size.
Load Data and Save Your Settings
A dataset is the price history that the script runs on. Each bar summarizes prices during one interval; 1D means one day per bar.
The chart may already show other data. For example, it may show the daily S&P 500 ETF (SPY) bars that this sample was measured on, or the dataset you loaded last. Load the Bitcoin sample so that your chart matches this guide.
Select the symbol/timeframe button at the bottom left of the chart. In Data Source, select Sample Data, Bitcoin (BTC/USD) and 1D, then Load. Confirm BTCUSD, 1D and 3,931 Bars in the chart status bar for this sample. Sample datasets may be refreshed later; always check the symbol, interval, bar count and date range. 3,931 Bars identifies the captured walkthrough, not a requirement that every later sample contain that exact number.
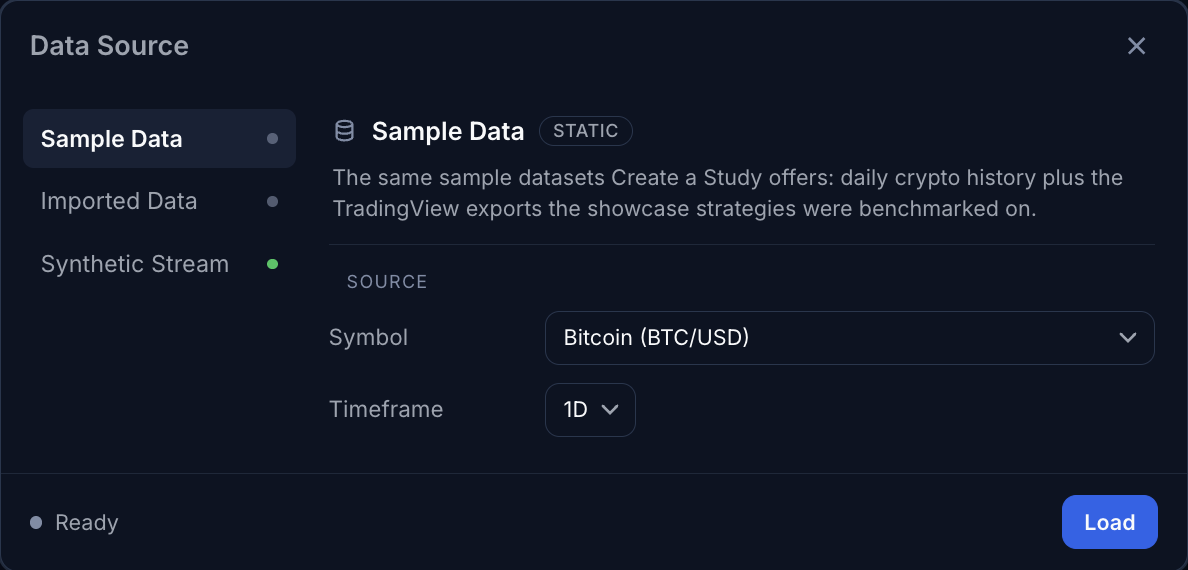
Load the dataset before you read the chart. When you select Optimize, the bars on this chart open in the New Study page in this browser. They are sent to AI Edge when you start the study. Select the image to open it at full size.
Open Settings below the editor. Leave the sample's starting values for this exercise:
| Input | Value for this exercise | What changes |
|---|---|---|
| ADX Length | 10 | Lookback for the directional movement index. |
| Minimum ADX | 15 | Trend strength required before a long entry is allowed. |
| Trend Length | 250 | EMA length that defines the orange trend line. |
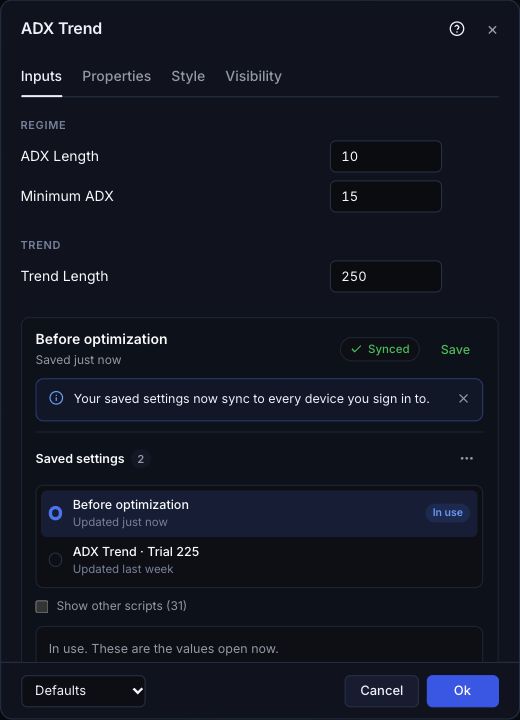
The sample's declared defaults, saved as Before optimization. This signed-in paid account shows Synced; where account sync is unavailable, the chip says This browser. Select the image to open it at full size.
Save these values under a name so that you can compare them with a trial later:
- Scroll to the saved Settings card at the bottom of the dialog and choose Save.
- Name the configuration Before optimization, then choose Save again.
- Check that the card shows Before optimization with the status Saved.
- Select Ok.
If the card hides the inputs, scroll inside the dialog. Save and Reopen Settings shows the save controls.
This example is a strategy, so Settings also has a Properties tab for the simulation assumptions. Leave those at the sample's declared values for this walkthrough. Strategy Properties explains that tab.
Choose a Backtest Signal
Skip this section if you are following the ADX Regime Trend walkthrough, and continue at Launch a Study. That script is a strategy(): its simulated orders already carry the backtest signal, and the editor reads Signals: Strategy Orders above the source.
Use this section when the open script is an indicator. An indicator draws plots and does not place orders, so the Optimizer still needs to know when it would be long, short or flat.
- Under Designate your backtest signal, above the source in the editor, confirm the plot that outputs the position signal. Studio may already have selected a compatible plot for you. The list adds signal after the title of each compatible plot.
- Long means a simulated position that benefits when price rises; short benefits when it falls; flat means no position. A compatible signal outputs
+1for long,-1for short, and can output0for flat. These are simulated positions, not orders placed with a broker. A price line or arbitrary measurement cannot substitute for this signal.
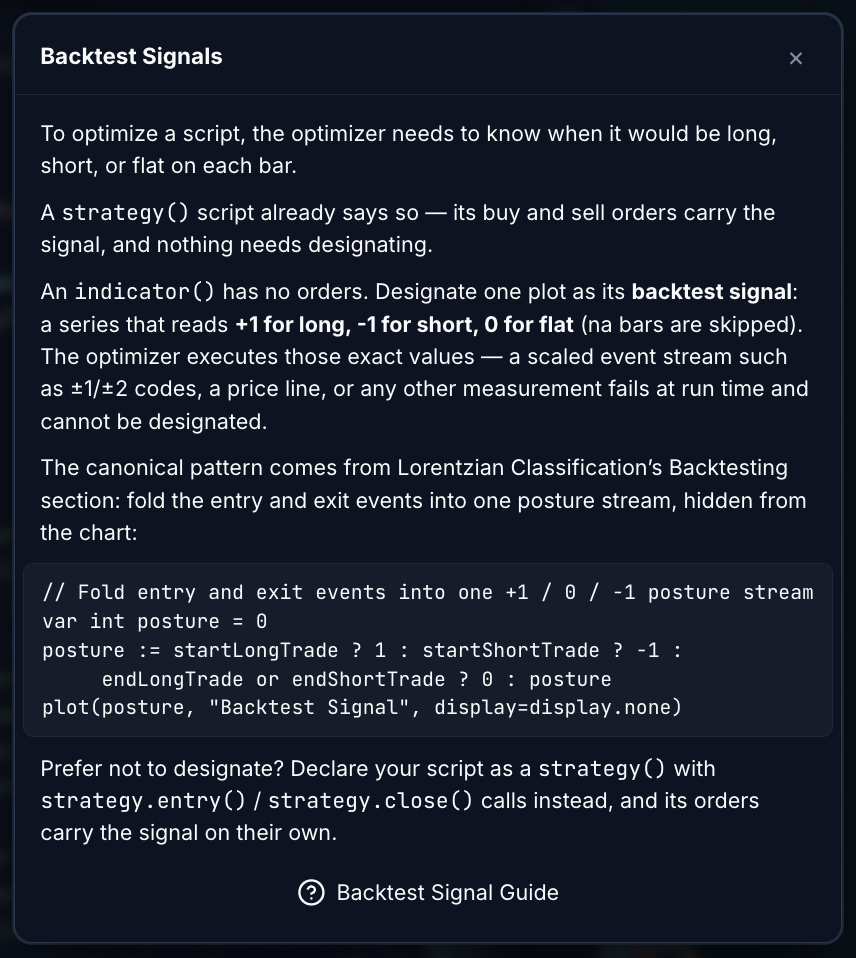
The help icon under Designate your backtest signal explains the required output. Read the first paragraphs; the longer code pattern is for adapting your own indicator later. Select the image to open it at full size.
Launch a Study
If Optimize is unavailable, read the guidance banner above the source. Fix the compilation or adjustable-input issue it identifies first. Dismissing the banner does not make an incompatible script eligible. An indicator that has no backtest signal yet shows no banner: choose a signal in the editor instead.
This study runs in your browser, but some data is still sent to AI Edge. Selecting Optimize uploads the compiled strategy. This compiled-strategy upload does not include your script's source. If you separately enabled source sync, saved source versions are also in your account. Starting the study sends the dataset and the study configuration. While the study runs, your browser sends the settings, the trade signals and the score of each trial. The What's Sent note on the run page lists these. Understand storage and data flow.
-
Select Optimize at the editor's top right. Wait for preparation to finish and the New Study page to open. An Opened From Studio note confirms what came over: ADX Trend Version 1, the 3,931 bars on your chart and your input values.
-
In the Study Name box at the top of the page, replace the suggested name with First comparison. Then read the sentence below the price chart. Each highlighted part is a button that opens its own editor. The sentence should start Optimize, then name ADX Trend with a Version 1 · From Studio tag. It should then name the daily Bitcoin data: a symbol that ends in BTCUSD, followed by Daily. The data is already loaded, so you do not choose it again.
-
Check that the sentence says varying all 3 settings. Select that part to open Settings to Optimize. Leave ADX Length, Minimum ADX and Trend Length on their declared ranges (
5–60,5.0–45.0,10–300). All three are searched. Each setting has an Optimize or Fixed choice: leave all three on Optimize, then select Done. There is no Price input on this sample. See the range controls. -
Set the trial count and the objective, then check Run Settings:
- Select the trial count in the sentence. In Number of Trials, choose Custom and enter
5. - Select the objective at the end of the sentence. A new study starts on Profit Factor. In Optimization Goal, choose Sortino Ratio, keep Scoring on Robust, then select Done. The sentence now ends with Robust Sortino Score.
- Under Run Settings, keep Minimum Trades at
10and Trial Evaluation on Full-Fidelity for this exercise. Leave Parallel Runs at1. On Free it stays at1, because Free runs one browser study at a time. Pro can run up to 2 browser runs at once, and Max up to 5.
- Select the trial count in the sentence. In Number of Trials, choose Custom and enter
-
Review the sentence, then choose Start in This Browser. The sentence should show 5 trials, in this browser and all 3 settings, and the page should show No credits near the button. If the button names something to fix instead, for example Set the Number of Trials to Start, select it and fix that first.
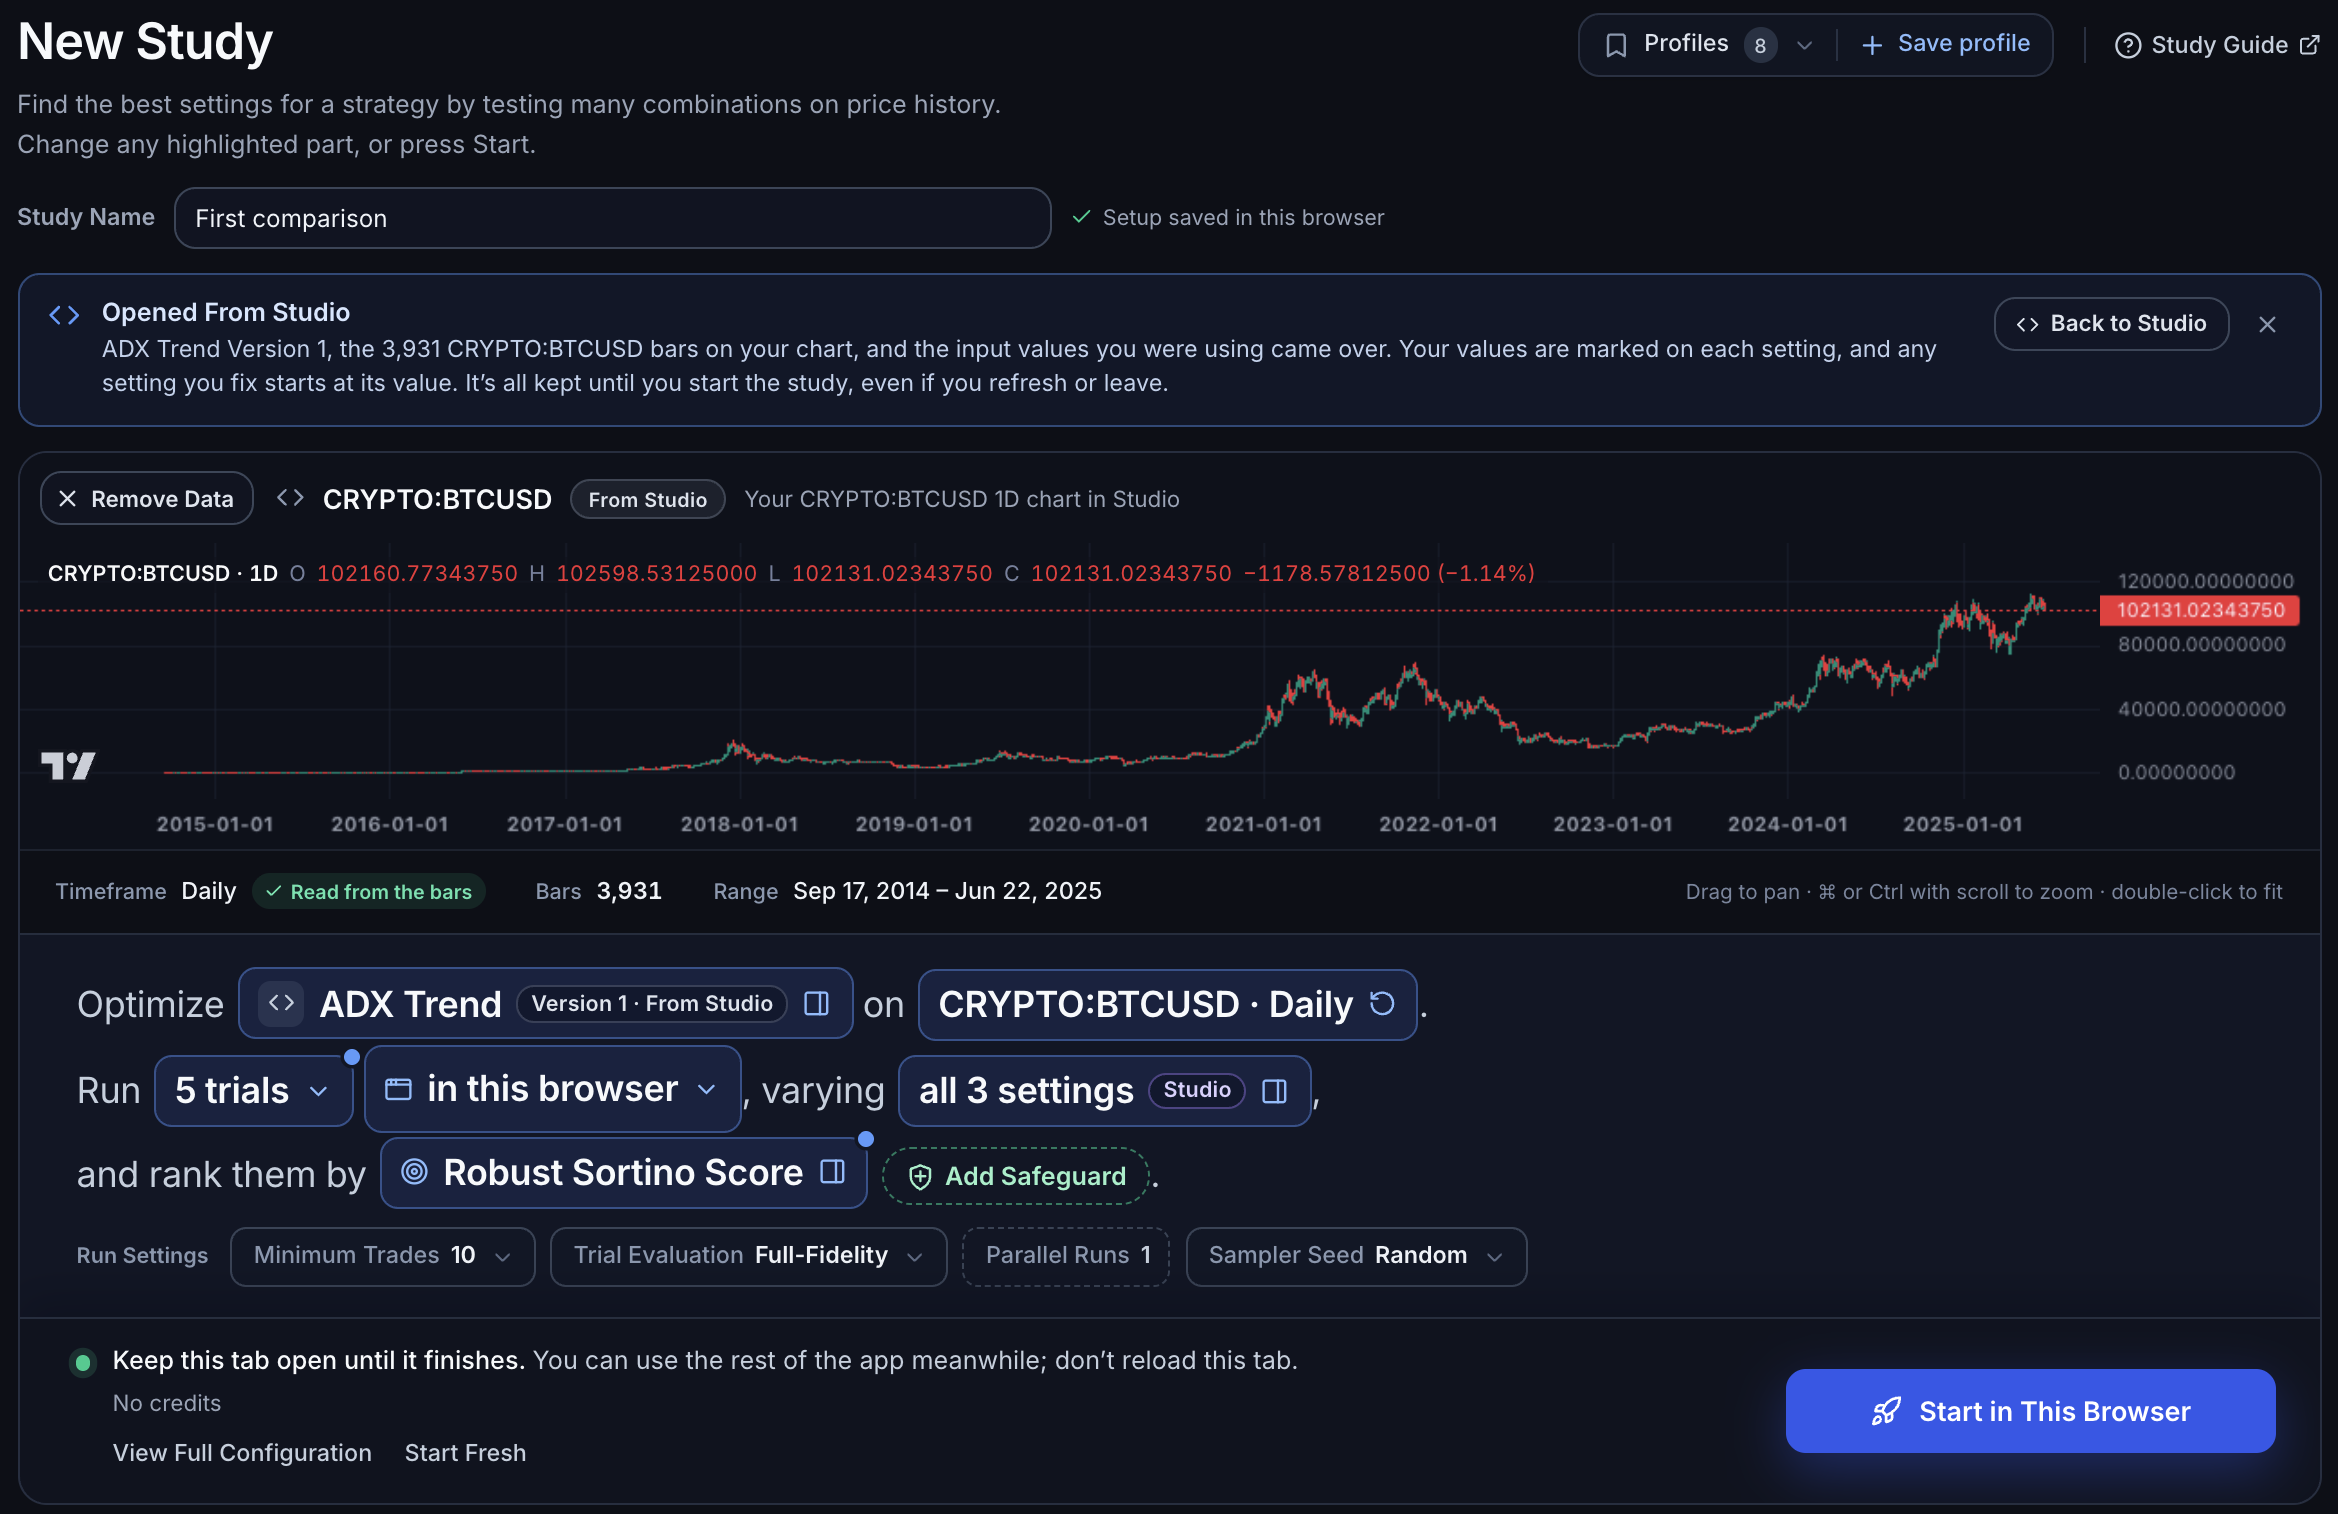
Final check before starting: the script, data and trial count all describe the same exercise. Read the highlighted parts of the sentence, then choose Start in This Browser. Select the image to open it at full size.
The in this browser part of the sentence is also a button. It opens Where This Study Runs, which has two options: This Browser and The Cloud. This walkthrough uses This Browser. It uses no credits and needs this tab open until the study finishes. The Cloud is part of a paid plan and uses credits.
Watch the Run and Review a Trial
The run page opens and the study starts. The page shows Running In This Tab and how many trials have finished.
Keep this tab open until the page shows Results Ready. A Keep This Tab Open Until Your Results Sync note on the page says the same. You can use other pages inside the app while the study runs. If the tab closes, results already saved on this device are kept for when you return.
To hold the run, choose Pause, then Resume to continue. To stop it, choose Stop Running. Trials that are already verified are kept.
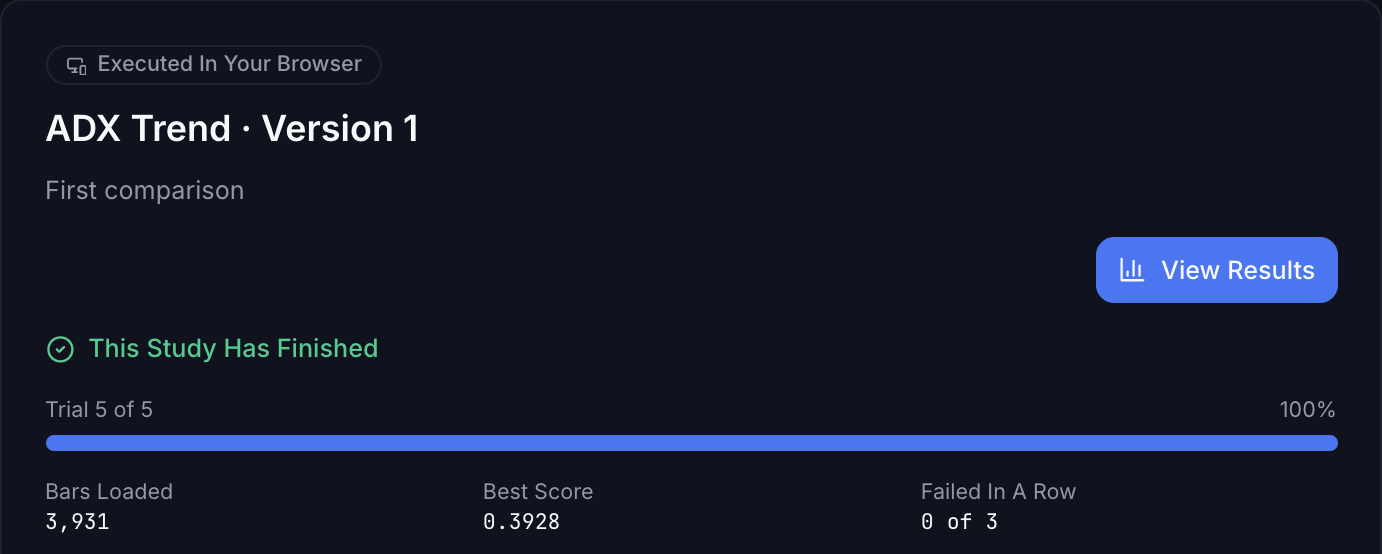
A completed run can show This Study Has Finished when you reopen it, as in this image. Select View Results to continue. While a run is still active, keep its tab open; you can use other app pages. Select the image to open it at full size.
The run is finished when the page shows Results Ready. Recorded trials have then synced to the study. Check the result status too: five attempted trials do not guarantee five ranked results. An attempt can fail, or it can finish but be ineligible, for example because it has fewer than the 10 closed trades that Minimum Trades requires. If the page shows Saved On This Device, keep the tab open: the trials are finished, but some results are not saved to your study yet.
Then review a trial and open its Settings in Studio:
- Choose View Results. To find the study later, select Studies in the sidebar, search for First comparison and open its title.
- Choose Use These Settings to inspect the values of the best trial. To inspect a different trial, choose Use Settings in that trial's row.
- Under Studio, choose See It in Studio. Studio opens these Settings on the study's data. Your script is not changed.
ADX Regime Trend is a
strategy(), so a study you start now is scored on its Executed Trades: its order fills, position sizes and commission. The Strategy Report's profit factor and closed-trade count should then match the trial's. An older study scored on Signal Returns prices position changes at bar closes instead, so its figures can differ. Check What the Study Scores. - Back in Studio, open Settings. Studio saved the trial's values as a configuration. Its name ends with · Trial and the trial number.
- Check that the script is still at Version 1.
Review a Trial, in Run a Study and Read Its Results, explains the results page in more detail.
You have completed the loop: script + Settings → study → trials → new Settings.
The study scored and ranked the trials on the bars you loaded. A high score does not show how those Settings perform on other data. Before you rely on them, check them on data the study did not use.
To make a new comparison, save another configuration or select Optimize again. The earlier study stays unchanged.
If Studio reports missing source or incompatible Settings, reopen the original script that the Settings were saved for, or recover it from a backup if you made one. A different script with a similar name will not work in its place.
Next: read your results, or learn how the objective scores a trial.