Studio Tools and Panels
Use this page when a script is open in AI Edge Studio and you want to see its output another way, change the chart's data or arrange the workspace. For a first walkthrough, start with Your First Study. To change a script's Inputs and Properties, see Save and Reopen Settings.
Choose a Pane
Studio opens with the editor on the left and the chart on the right. The tabs above the chart switch between views of the same run. Point to a tab to see what it shows.
| Tab | What it shows |
|---|---|
| Chart | Price bars with the script's plots and drawings. |
| Strategy | Trades, position and equity. See Strategy Reports. |
| Plots | The value of each plot on every bar. |
| Context | The symbol, timeframe and session values that the script receives for this data. |
| Advanced | How Studio translates your script into instructions it can run. |
| Profiler | How long each line of your script took to run. Turn on Profiler in More Editor Actions to enable Profiler Mode, and Studio runs the script again to measure it. |
The Strategy tab appears only when the script is a strategy. The Profiler tab appears only while Profiler Mode is on or a profiled run is on screen. If one of these tabs is in a pane of its own, the pane says This view is available when the active run produces it. until a run produces that view.
To arrange the workspace, drag a tab into another pane or to the edge of a pane. You can also right-click a tab, or move the keyboard focus to it and press Shift+F10 or the Menu key. The tab menu has Move Tab Left, Move Tab Right, Move Tab to Next Pane and Move Tab to New Pane.
The Pane Actions button (⋯) at the right end of the tabs has Move Pane, Merge with … Pane, such as Merge with Editor Pane, and Reset Workspace Layout. Reset Workspace Layout puts the editor back on the left and the chart on the right. It does not change your source.
Studio keeps the layout in this browser. If it says Layout could not be saved. It will remain available for this session., the layout lasts only until you close or reload the tab.
Inspect the Compiler Stages
Open Advanced above the chart to see how the displayed script becomes runnable instructions. Choose AST, CSIR, CSIL or WASM. These are inspection views; changing the selected stage does not choose the engine for your chart.
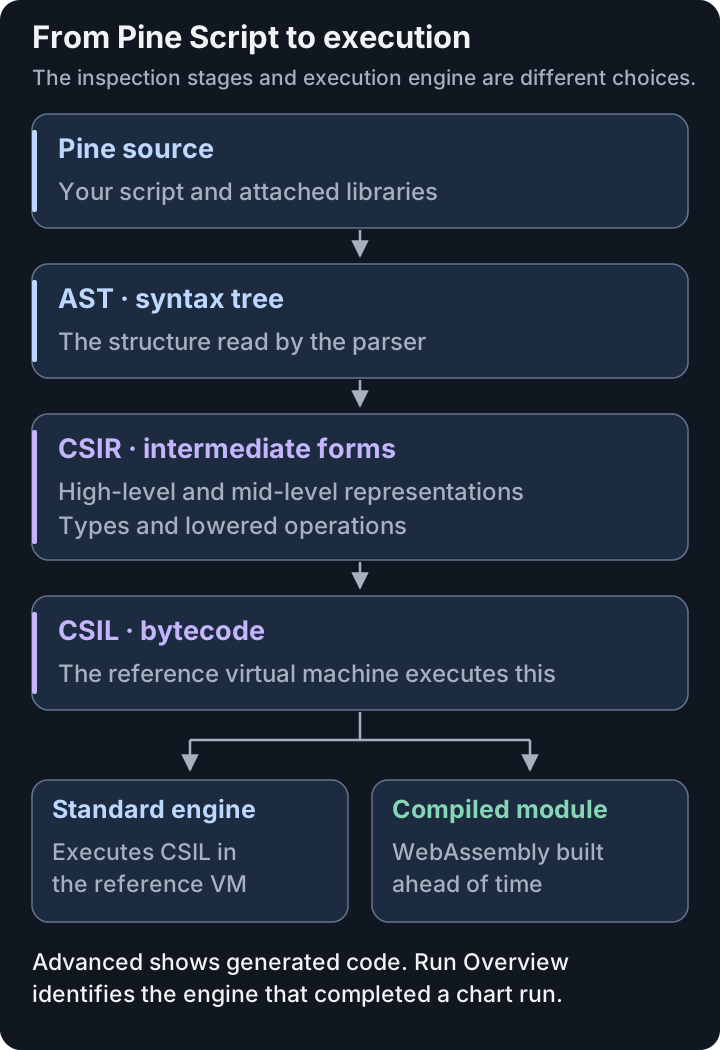
The standard engine and an ahead-of-time WebAssembly build share the compiled bytecode. A module shown in Advanced is separate from evidence of which engine completed the chart run.
| Stage | What you are inspecting |
|---|---|
| AST | The abstract syntax tree: the structure the parser reads from the source. |
| CSIR | PineWASM's intermediate representation. Its high-level and mid-level forms make the program's types and lowered operations explicit. |
| CSIL | PineWASM's intermediate-language bytecode, which the reference virtual machine executes. CSIL is not WebAssembly. |
| WASM | A WebAssembly module built from that bytecode on demand. The view can report why a module could not be built. |
The linked views associate generated instructions with their source lines and attached libraries. Linked groups them by source; Raw shows the listing. If compilation fails, a stale label means you are viewing the last successful compile, not the current editor text. Fix the problem before you read the view as your latest code.
Read the WASM View
The WASM view shows the module's size, functions and instruction counts. Its byte map separates Your Script, Budget Checks, Setup & Frames, Runtime Library and Other. Largest Lines lists up to five source lines that compile to the most bytes. These are code-size figures, not timings or proof of where your run spends time. Use Profiler for measured line timings.
About These Figures explains the counts. A module can be Native, with instructions compiled to WebAssembly, or Hosted, delegating the script to the reference interpreter. Read Can Run Your Chart or Chart Uses the Interpreter and any reason shown. Live updates, profiling and inputs connected to another script can require the interpreter even when a module can be displayed.
The WASM Compiler is always on, so there is no switch for it. It is separate from opening Advanced → WASM. To confirm where a particular chart run executed, open the status control below the editor and read Engine in Run Overview. In browser, compiled Wasm means a module built by the WASM Compiler ran the chart. In browser means the standard engine ran it; a WASM Compiler row, when shown, says why. A successful compile, a visible module and a successful cloud check are three different checks. The cloud check tests whether one exact version of your own strategy can run in a cloud study.
Choose Chart Data
The data in use is named at the bottom left of the chart, such as Sample Data · EURUSD · 1D. Select it to open Data Source, choose a source on the left, then use its load or connect control.
| Source | What it is | How to use it |
|---|---|---|
| Sample Data | Recorded history from AI Edge, the same samples New Study offers: daily Bitcoin, Ethereum, Solana and XRP; daily EUR/USD, SPY, NVIDIA and U.S. 10-year yield bars; and 5-minute SPY, NVIDIA and Microsoft bars from IEX. | Choose a sample, then select Load. |
| Imported Data | CSV history saved On This Device, or a dataset you choose In Your AI Edge Account. | Import or select a local CSV, then select Load. For an account dataset, follow Load a Dataset From Your Account. |
| Synthetic Stream | Generated bars that keep arriving, like a live feed. They are not market data, and nothing is fetched over the network. | Choose a Regime (Standard, Calm or Wild) and a Seed number, then select Connect. Stop Stream stops it. |
When you choose an IEX sample, the dialog shows IEX's terms: Data provided for free by IEX. By accessing or using IEX Historical Data, you agree to the IEX Historical Data Terms of Use.
To add a CSV, use Import CSV: enter a Name (optional), check Quantity, then select Choose CSV file…. The imported dataset is selected under On This Device. Select Load to put it on the chart.
Studio reads an imported file's timeframe from its bar times. If the bars could fit more than one timeframe, the dialog asks you to choose one. With Quantity left on Read From The File Name, a file named like a crypto pair, such as COINBASE_BTCUSD, trades in fractions of a coin. For any other crypto file, set Quantity to Fractions Of A Coin (Crypto) before you choose the file. With whole units, a strategy that buys less than one coin places no trades. Choose the Quantity setting that matches the instrument rather than changing it to force trades to appear.
To delete a local imported dataset, select the trash icon beside it under On This Device. It is deleted at once, without a question, so keep the original CSV file.
With Real-Time Data Feeds turned on (Experimental, Max only), the list also offers live exchange feeds. See Try Experimental Features.
Load a Dataset From Your Account
Imported Data keeps two groups separate: On This Device contains local CSV imports; In Your AI Edge Account lists datasets saved in your Dataset Library. Sign in to read your account's list.
- Open Data Source from the chart and select Imported Data.
- Under In Your AI Edge Account, choose an Account dataset. Check its name, symbol, timeframe and bar count. Use Previous account datasets or Next account datasets to move through the list, or Refresh account datasets to read it again.
- Select Load account dataset. Opening the list or choosing a name does not download its bars; this button loads only the selected dataset onto the chart.
You can load datasets you already own with a Free account, including after a downgrade. A paid plan is needed to save new datasets to your account.
Loading reads the selected account dataset for this visit. It does not create a copy under On This Device, and its bars are not stored in Session Recovery. After a reload, choose the account dataset again. Signing out or changing accounts clears the previous account's data from the chart; select data for the account you are now using.
If a load fails, the current chart stays in place. Read the error, then use Refresh account datasets and select the dataset again. If the account-data service is unavailable, use a local CSV or sample while it recovers.
This dataset exceeds the 64 MiB browser response limit. Its account copy is unchanged. means the chart download is too large for this browser path. Choose a smaller account dataset or a sample. This technical response limit is separate from plan storage and upload limits.
If a Data Source Does Not Load
When an import fails, the dialog says why in red, usually with the line number. Fix that line in the file, then import it again. A CSV file for Studio must follow these rules:
- The first row names the columns
time,open,high,lowandclose, in lower case. Avolumecolumn is optional. Without it, volume is 0. Studio ignores other columns. - Each
timeis a whole number of seconds since January 1, 1970, UTC (a Unix timestamp). Use seconds, not milliseconds or date text. - Rows run from oldest to newest, and no time appears twice.
- Every row has as many values as the first row has column names.
- Prices are numbers. In each row,
highis at leastopen,closeandlow, andlowis no higher thanopenorclose. - Each
volumevalue is a number of 0 or more.
These three rows show the format:
time,open,high,low,close,volume
1735689600,100,102,99,101,1000
1735776000,101,103,100,102,1200
1735862400,102,104,101,103,900
New Study reads files with its own rules. It also accepts timestamp, milliseconds and dates. See Check an Imported File.
Replay Recorded Bars
Bar Replay shows recorded bars one at a time, so you can watch the script react. It works with Sample Data, local Imported Data and datasets loaded from In Your AI Edge Account, with at least 11 recorded bars.
- Select Replay at the bottom of the chart.
- Set Start at (UTC) and a Speed in bars per second.
- Under After replay, choose Stop at the last recorded bar. To keep going with generated bars after the recording ends, choose Continue with simulated bars instead.
- Select Start replay.
While it runs, use Pause and Play, Next bar while paused, Reset to start again, or Exit to leave. The button shows the state, such as Replay: Playing or Replay: Replay complete. Closing the Bar Replay panel does not stop playback.
Studio draws each recorded bar in four simulated steps. These steps are moves inside the bar, not recorded trades.
For an account dataset, replay changes which bars are on the chart. While Bar Replay is active, Optimize and Copilot cannot hand those bars to a new study as the original saved account dataset. This applies while replay is paused or complete, and while it continues with simulated bars. Select Exit to restore the full original recording before creating a study, or load the account dataset again in Data Source. Pausing replay or closing its panel does not restore the original recording.
If Replay cannot be selected, point to it to see why, such as Replay needs at least 11 recorded bars.
Change Chart Appearance
Right-click the chart and choose Settings.... These settings change only how the chart looks. They do not change your script, its Inputs and Properties, or any result.
| Tab | What it changes |
|---|---|
| Symbol | Candle bodies, borders and wicks, such as Up candle body color and Down candle body color. |
| Status line | What the legend at the top left shows. |
| Scales and lines | Price scale labels, lines and mode. |
| Canvas | Grid lines and the symbol watermark. |
| Trading | Whether paper orders and executions show on the chart. |
| Alerts | Whether alert lines show, and the alert sound. |
| Events | Whether events show. Session breaks is not supported yet. |
Ok keeps your changes. Cancel puts back the settings the dialog opened with. To reuse a look, open Template at the bottom of the dialog and choose Save as.... Then choose that name from Template to apply it again.
Studio keeps chart settings, templates and drawings in this browser.
Restore a Scale or Legend Arrangement
Right-click the price scale to choose Regular, Percent, Indexed to 100 or Logarithmic, or to turn on Invert scale. To get back to a normal view, choose Regular, turn on Auto (fits data to screen) and turn off Invert scale.
Right-click the time scale and choose Time zone to show times in another zone, such as UTC or (UTC-4) New York. Reset time scale fits the time axis to the chart again. A time zone changes only how times are shown. The data's timestamps stay the same.
Each script on the chart has a row in the legend at the top left, with Hide, Settings, Source code, Remove and More buttons. More (⋯) has Visual order, Visibility on intervals, Move to, Pin to scale, Pine logs..., Copy and Object tree, among other items:
- Move to offers New pane below for a script on the price chart, or Existing pane above for a script in its own pane. Choose the other one to move it back.
- Pin to scale shows the current choice, such as Pin to scale (script default).
- Visual order and Pin to scale have no single reset, so note the setting before you change it.
- Pine logs... lists what the script wrote with
log.info(),log.warning()andlog.error()on its last run, newest first. Select a time to move the chart to that bar. - Copy copies the script's source. Object tree opens the list of objects on the chart.
Right-click the legend itself to choose what it shows, such as Symbol title and Indicator values.
Attach a Missing Library
When a script imports a library that Studio does not have, a notice above the editor says so, such as 1 Library Needs Source. Studio first tries to fetch the published library's public source from AI Edge. If that does not work, attach the source yourself:
- Select Resolve in the notice. Or right-click the
importline and choose Resolve Library…. - In Resolve Library, select Resolve to look up the exact version the script imports.
- If Studio still cannot find it, open Upload or Paste Source. Select Choose File to pick the library's
.pineor.txtfile, or Paste Source to paste it. Use the complete library source, with itslibrary()declaration, up to 1 MB. - When the check passes, it says how many exports it found. Select the This Is check box, which names the library and its version, to confirm the published version. This is the library's own version, not the Pine Script® version on its
//@versionline. - Select Attach and Remember.
The editor then compiles the script again. The library source stays with the script and its saved versions, and is included if you explicitly enable source sync for that script. A source check confirms the declaration and exports; the subsequent compile still decides whether the script and library are supported. If the check fails, it says why, for example that the source declares a different library. Keep a copy of the library file with your backup, because Export .pine saves only the script.
The import line's right-click menu has two more items:
- Open Library opens the library's source in an editor tab. If Studio does not have the source yet, it opens Resolve Library.
- Open on TradingView opens the library's TradingView page in a new browser tab. If Studio cannot find the page, or the browser blocks the new tab, it does the same as Open Library.
Ctrl-click (⌘-click on a Mac) on an import line does the same as Open on TradingView.
Add and Manage Drawings
The drawing toolbar beside the chart has six groups of tools: Trend tools, Gann and Fibonacci tools, Patterns, Forecasting and measurement tools, Geometric shapes and Annotation tools. It also has Measure, Zoom in, Zoom out, emoji marks and a magnet that snaps points to the nearest open, high, low or close.
- Open a group with its arrow, then choose a tool. Point to an icon to see its name.
- Click the chart to place each point. Press Escape to cancel a drawing you have not finished.
- Double-click a finished drawing to change its colors, lines and text. Or right-click it for Clone, Copy, Visual order, Lock, Hide, Settings... and Remove.
- To find a hidden or locked drawing, right-click the chart and choose Object tree. Each row there can show or hide, lock or unlock, or remove its object.
Drawings are notes on the chart. They do not change your script, its results or a study. Long position and Short position draw a target and a stop; they do not place orders.
Drawings are tied to bar times and prices, so check them after you change the chart's data. Remove objects, the trash icon on the toolbar, removes a whole group of objects at once, without a question.
Find Similar Price Patterns
Where enabled, Find similar patterns searches the chart's loaded history in your browser. The feature needs Max, including an active Trader Max Boost. Its matches describe similar past price shapes; they are not trading signals or a forecast.
- Select Find similar patterns in the drawing toolbar, then drag across the bars you want to compare. You can also hold Shift and drag when no drawing tool is active.
- Read the Patterns panel. Each match shows dates, similarity and its length relative to your selection. Previous match and Next match move the chart to a match; Zoom to All frames the selection and matches together.
- To inspect the later history of those matches, turn on What Followed and choose Look Ahead. A dashed line shows the median of the paths that followed the matches, and a shaded band holds the middle half of them, so at any bar about half the paths lie outside it. These are past paths, scaled to your selection's length and volatility, not future prices. The panel says how many matches this summary uses. It can report that there is not enough later history to draw the summary.
- Use Clear pattern selection, or Escape, to clear it. Float Panel and Dock Panel change the panel's position.
No close matches can still show the nearest available results. A high similarity percentage measures shape similarity, not the probability of the same outcome. If you select a different segment because its matches were followed by a better outcome, you are choosing the result rather than testing the pattern. Keep your original selection when you compare results.
If a Control Is Missing
Studio in AI Edge has no terminal, file explorer, engine picker, or separate Libraries and Diagnostics tabs. Use these instead:
- Problems in your script: red underlines in the editor, and Run Overview, which opens from the status control below the editor. See Powered by PineWASM.
- Generated instructions or a WebAssembly module: Advanced above the chart. See Inspect the Compiler Stages.
- A missing library: the notice above the editor. See Attach a Missing Library.
- A tab that is not there: Strategy needs a strategy script, and Profiler needs Profiler Mode. See Choose a Pane.
If your work seems lost after a reload or an error, see When Something Goes Wrong.