Objectives and Scores
- An objective scores each trial's backtest so the Optimizer can rank the Settings it tested. It compares past simulations; it does not predict future trades.
- A new study is ranked by Profit Factor when your strategy offers it, otherwise by Sortino Ratio when it offers that. You can choose another objective or add more.
- Sortino Ratio and Sharpe Ratio also ask for Robust or Traditional scoring.
- A new study of a
strategy()script is scored on its Executed Trades: order fills, position sizes, commission and slippage, like Studio's Strategy Report. Indicator scripts, the built-in Lorentzian Classification strategy and older studies are scored on Signal Returns at bar close, with no fills or sizing and zero trading cost unless you set a signal cost. Check What the Study Scores.
An objective function is the formula the Optimizer uses to score each trial's backtest, so it can tell which tested Settings did better. You choose it before starting a study. It is a way to compare past simulations, not a promise about future trades.
When your strategy offers Profit Factor (gross profit divided by gross loss), a new study starts ranked by it. Otherwise, a new study starts ranked by Sortino Ratio when the strategy offers that. You can choose another objective, or add more objectives to the same study. If you are following your first study, use the objective that guide names.
This page lists every objective. Most of the detail is about Sortino Ratio and Sharpe Ratio, because these two also ask you to choose Robust or Traditional scoring. The examples use Sortino Ratio with Robust scoring, which the app names Robust Sortino Score. The last section explains how the Impact of each setting is calculated.
What Is the Optimizer Trying to Do?
Imagine giving someone several versions of the same recipe and asking for the “best” one. They need to know whether you mean quickest, cheapest or tastiest. An optimizer needs the same kind of instruction. A configuration is one set of input values for your script. The configuration with the highest win rate does not always have the highest score under the objective you selected.
A trial is one attempt. The app gives your script one configuration and backtests it. A backtest simulates what the script would have done on the price history you chose. The app turns the resulting trades into a score. The search uses the results of completed trials to choose which configurations to try next. Its first few choices do not use earlier results.
Changing the objective can change both the ranking of already tested configurations and which configurations a new search favors. It does not rewrite the script. To see the effect of the objective alone, keep the data and all other settings the same and change only the objective.
Check What the Study Scores
A study is scored on one of two bases, and it keeps the basis it started with. Its card in the Study Library names the basis: Executed Trades or Signal Returns. Backtesting vs. Optimization compares these with Studio's Strategy Report.
| Basis | Which studies use it | What it scores |
|---|---|---|
| Executed Trades | A study of a strategy() script that you start now. | The strategy's simulated orders under its Properties: fill prices, position sizes, commission and slippage. Trades that open and close inside one bar count. Profit factor, closed-trade count and account drawdown use the same results as Studio's Strategy Report for the same script, data and Settings. |
| Signal Returns | A study of an indicator() or of the built-in Lorentzian Classification strategy, and any study started before executed-trade scoring. An older strategy() study can show it too. | Closed trades built from the script's position signals, with each entry and exit priced at the close of the bar. Each trade's return is its gain or loss divided by its entry price, as if every trade used the same amount of money. It does not simulate order fills or position sizing. Its optional flat signal cost is deducted before scoring; zero excludes fees and slippage. |
Neither basis scores the price movement of a position that is still open at the end of the data. On Executed Trades, the commission already paid to open that position does count.
On Signal Returns, Studio's Strategy Report is a separate measurement. It simulates the strategy's orders with the script's Properties, so its trade count and profit factor can differ from the study's. To compare the two, use the same script, data and settings, and read each result by its own rules.
Scores on different bases measure different things. Compare lists each study's Scoring basis, as Executed Trades (Fees Included) or Signal Returns. When the studies use different bases, it marks the rows Different accounting: not ranked and names no winner.
Trading Costs and the Omega Target
For Signal Returns, open New Study → Optimization Goal → Trading Costs and Confidence. Set Signal Round-Trip Cost as a percentage from 0% to 5%. The default is 0%: fees and slippage are excluded unless you set a cost.
The Optimizer subtracts that same cost from every closed signal trade before calculating any of the ten objectives, additional objectives or trade metrics. For example, a 0.1% gross win with a 0.2% cost becomes a 0.1% loss. This is invented arithmetic, not a fee estimate. Trade count and Minimum Trades eligibility stay the same. The setting is a flat estimate; it does not simulate separate entry/exit fees, spread, funding or changing slippage.
On Executed Trades, the script's Properties already supply commission and slippage. A nonzero Signal Round-Trip Cost is refused so the same costs are not deducted twice.
Target Return per Trade is separate: Omega measures gains and shortfalls against that additional hurdle after any costs. It changes only Omega, not the trade returns or other objectives. Do not include a cost in the target when it is already deducted by the signal cost or the strategy's Properties. Set the Omega Target.
These are simulated trading costs, separate from AI Edge credits or subscription charges. The study stores its cost and confidence settings; Run Again and follow-ups carry them. Results name a nonzero signal cost. Compare studies only when their costs, objectives, accounting basis and active confidence settings match. An assistant's prepare confirmation also states which costs apply. Robust's trade-count weight is not a cost deduction.
Choose Your Objective
- On New Study, select the objective at the end of the study sentence, after “and rank them by”. A study that runs one baseline evaluation reads “and score it by” instead. On a phone, select the Rank by row. The Optimization Goal panel opens.
- Under Primary Objective, select an objective from the list below. The row marked Default is the starting objective for your script. When a study can use only one objective, this heading reads Objective.
- If you selected Sortino Ratio or Sharpe Ratio, choose Robust or Traditional under Scoring. Robust is the default. The other objectives have no scoring choice.
- Read the guidance under the selected objective. It says when to use the objective and gives a Watch Out note.
- Select Done. Then check that the study sentence names the objective you intended, for example Profit Factor, Robust Sortino Score or Traditional Sharpe Ratio.
Understand Scores at the bottom of the panel opens this guide in another tab. Your study setup stays open.
The panel lists up to 10 objectives in three groups. A script that supports fewer objectives shows fewer, and the panel says how many of the 10 it ranks by. A higher score is better for every objective except Maximum Drawdown, where a lower drawdown ranks first.
Risk-Adjusted
- Sortino Ratio: average per-trade return relative to downside variability only. Has a Scoring choice.
- Sharpe Ratio: average per-trade return relative to total return variability. Has a Scoring choice.
- Deflated Sharpe Ratio: a Sharpe score from 0 to 1, adjusted for testing many configurations.
- Omega Ratio: gains above your target return per trade, divided by shortfalls below it. Set its target.
Drawdown-Based
- Calmar Ratio: annualized growth divided by maximum drawdown, using the compounded per-trade returns.
- Recovery Factor: the sum of per-trade returns divided by the largest fall in their running total.
- Maximum Drawdown: the largest peak-to-trough loss.
Raw Metrics
- Raw Net Return: the sum of per-trade returns, before risk adjustment. On Signal Returns, any configured signal cost is subtracted first.
- Profit Factor: gross profit divided by gross loss.
- Win Rate: the share of closed trades that are profitable.
On Executed Trades, four objectives use account money instead of per-trade returns, after the commission paid:
- Raw Net Return: realized net profit divided by initial capital.
- Recovery Factor: realized net profit divided by the largest cash drawdown.
- Calmar Ratio: annualized realized growth, from the first closed trade's entry to the last exit, divided by the maximum percentage drawdown.
- Maximum Drawdown: the largest percentage fall from the realized-equity peak.
On Executed Trades, Profit Factor is realized gross profit divided by realized gross loss in account currency, so position sizes affect it. Omega Ratio still uses per-trade returns.
No objective is universally better. Each one rewards a different characteristic of the same simulated trades, and each has a blind spot that its Watch Out note describes.
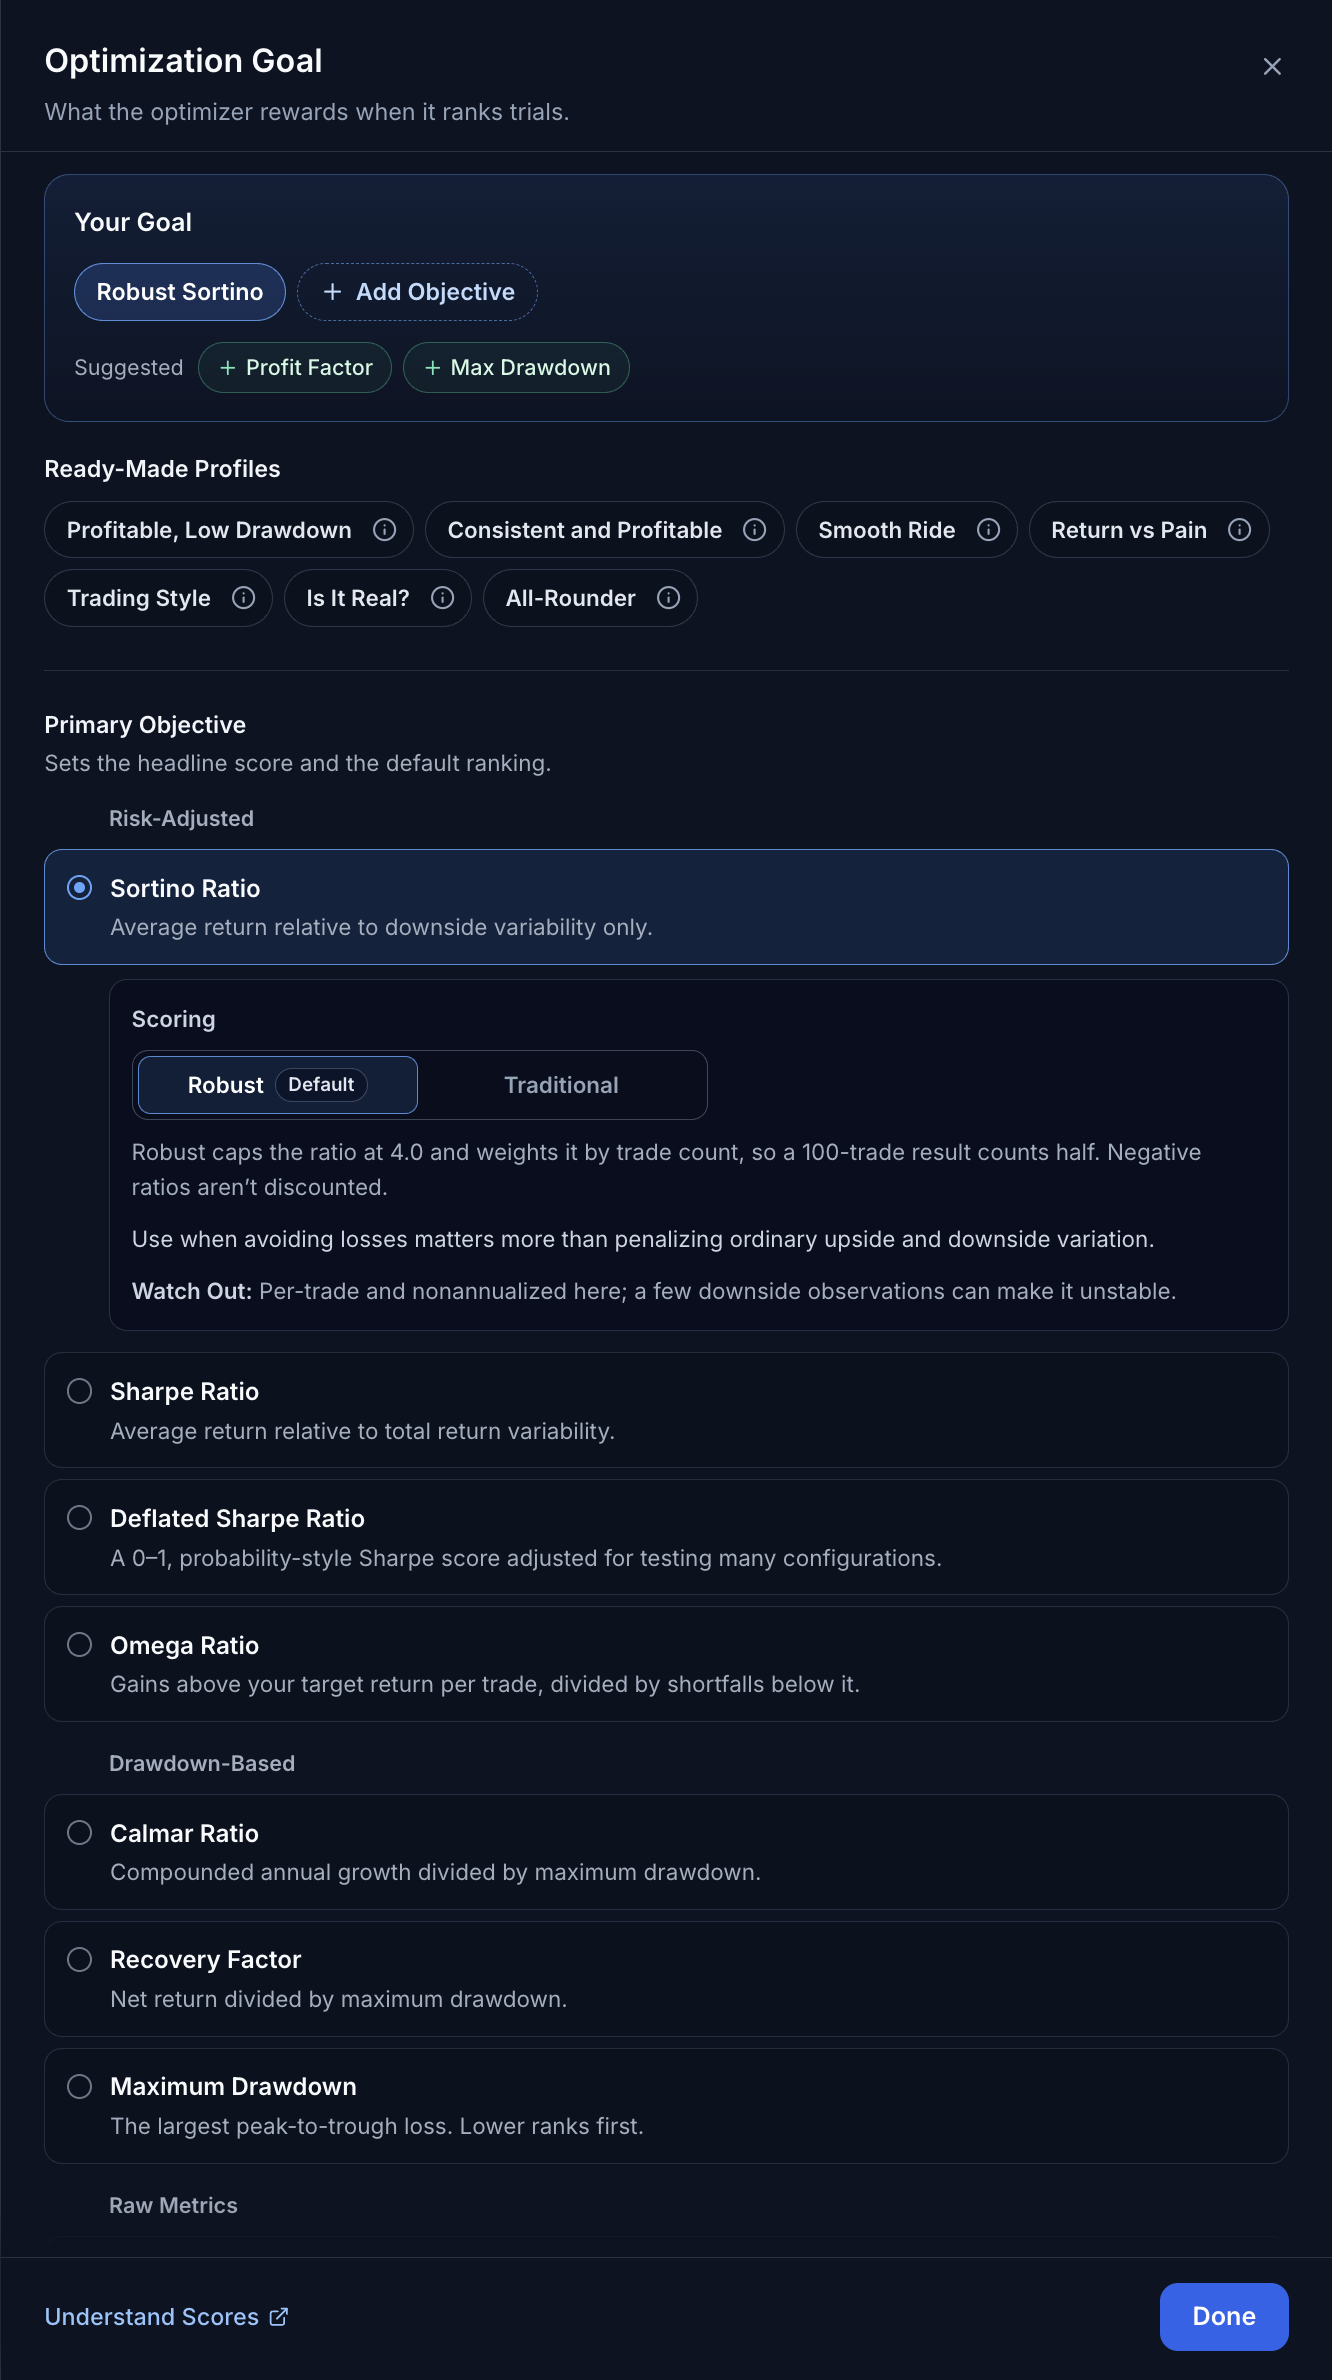
Shown with ADX Regime Trend selected. In Optimization Goal, choose an objective, then choose Robust or Traditional scoring for Sortino or Sharpe. The selected objective expands to show its guidance. Understand Scores opens this guide. Select the image to open it at full size.
Match the Objective to Your Question
| Your research question | Objective to inspect | What it can miss |
|---|---|---|
| How large are gains relative to losses? | Profit Factor | The timing and sequence of those losses. |
| How does average return compare with downside? | Sortino Ratio | Sparse downside observations can make the ratio unstable or undefined. |
| How does average return compare with all variation? | Sharpe Ratio | Large positive outliers also increase measured variation. |
| How deep is the worst cumulative loss? | Maximum Drawdown | A shallow drawdown alone does not imply a worthwhile return. |
| Do trades clear a specified return threshold? | Omega Ratio | The result depends on the target, which is an additional hurdle after any costs. |
| How sensitive is the selection to trying many configurations? | Deflated Sharpe Ratio | Its adjustment does not replace an untouched evaluation period. |
Use additional objectives to inspect trade-offs. A label such as Balanced Winner describes the tested candidates under the selected goals, not a forecast or an investment recommendation.
Sortino or Sharpe?
Both ratios divide the average trade return by a measure of how much the returns vary. They differ in which returns count as variation:
- Sortino counts only the downside: returns below zero. A return at or above zero adds no downside, but that trade still counts in the average.
- Sharpe counts the variation of all trade returns, including positive ones.
So one unusually large winning trade adds to the variation in Sharpe but adds nothing to the downside in Sortino.
Set the Omega Target
When Omega Ratio is one of your objectives, set Target Return per Trade in Optimization Goal. A trade counts as a gain only by the amount it returns above this target. It counts as a shortfall by the amount it falls below the target.
- The default is 0.2% per trade. You can set it from 0% to 5%.
- A higher target is stricter. It is an extra hurdle after the study's costs. Do not include costs already deducted through Signal Round-Trip Cost or a strategy's Properties a second time.
- At 0%, Omega is the ratio of summed positive to summed negative trade returns. On Signal Returns, it is the same ratio as Profit Factor, except that Omega needs at least two closed trades to score. On Executed Trades, it can differ from the account-money Profit Factor when position sizes differ.
The study sentence shows the target, for example Omega Ratio above 0.2% per trade. Results shows it as Target: 0.2% per trade. An Omega study from before this setting existed shows a target of 0%. Compare Omega scores only between studies that used the same target, trading cost and accounting basis.
Add More Objectives
One objective can reward a result you would not accept. For example, Profit Factor ignores the order of trades, so it cannot tell a run of losses from the same losses spread out. A second objective, such as Maximum Drawdown, can cover that blind spot.
In Optimization Goal, Your Goal lists the objectives you have chosen. The first is marked Primary. The primary objective sets the headline score and the default ranking. To add another objective, do one of these:
- Select Add Objective.
- Select an objective beside Suggested, when the panel shows one.
- Select one of the Ready-Made Profiles, such as Profitable, Low Drawdown (Profit Factor with Maximum Drawdown). Each profile explains why it works and when to pick it.
While a study has one objective, the study sentence also shows Add Safeguard. It opens the same panel.
To change the primary objective
- In Your Goal, select the primary objective. The Primary Objective list opens.
- Choose another objective.
- If you choose one of your additional objectives, the two swap places. To drop the former primary, select its Remove control.
- If you choose a new objective, it replaces the former primary. Your additional objectives stay.
The primary objective itself has no Remove control.
Before you add an objective, know what changes:
- Trials and credits stay the same. The study uses the same trials and credits as a study with one objective. Every trial is scored on each objective, and each objective guides a share of the trials.
- Early Pruning is off. A study with more than one objective evaluates every trial in full.
- Sortino and Sharpe share one Scoring choice. If the study uses both, Robust or Traditional applies to both.
- Results show more:
- Balanced Winner: the trial that no other trial beats on every chosen objective and that ranks best on average across all of them.
- A Trade-Offs chart. It highlights the best trade-offs: the trials that no other trial beats on every chosen objective. Its Best Trade-Offs view fits the chart to those trials. Show as Table lists the trials instead, including eligible trials the chart cannot plot because an axis score is N/C.
- Viewing:, which shows the results for one objective at a time.
A study can have up to 10 objectives. With four or more objectives, each one gets a less focused search.
While a study with more than one objective runs, the runner and the results page offer Continue With Primary Only. Use it when you want the primary objective alone to choose the remaining trials. The confirmation, Continue With Primary Only?, says what changes: from the next trial, only the primary objective proposes new trials, and the trial count stays the same. Trials that already finished keep their scores on every objective, so the trade-off chart still covers them. Select Continue With Primary Only to confirm, or Keep All Objectives to cancel. You cannot undo this for that study.
Why Does Robust Change the Ratio?
This section applies to Sortino Ratio and Sharpe Ratio only.
A few favorable trades can produce a very large positive ratio. Robust deliberately reduces the influence of such a result in two steps:
- It caps a positive ratio at 4.
- It multiplies the capped ratio by a weight that grows with the number of trades.
The result favors configurations that have more trades behind them, and it limits the reward for an extreme ratio. The trade-off: Robust can also lower the rank of a genuinely promising strategy that trades rarely, and it ignores any difference between ratios above the cap.
The app calls this weight confidence. It is only a mathematical weight. It is not a measured probability that a strategy works, a statistical confidence interval, or proof against overfitting (Settings that fit the past data by chance and fail on new data). More trades can still come from the same market regime or correlated signals.
Traditional removes the cap of 4 and this weight. It lets the search maximize the underlying ratio directly. Only the numerical limits apply. Its trade-off is greater sensitivity to unusually high ratios from small samples.
Both methods still apply Minimum Trades. With either method, check the result on data that was not used to choose the Settings.
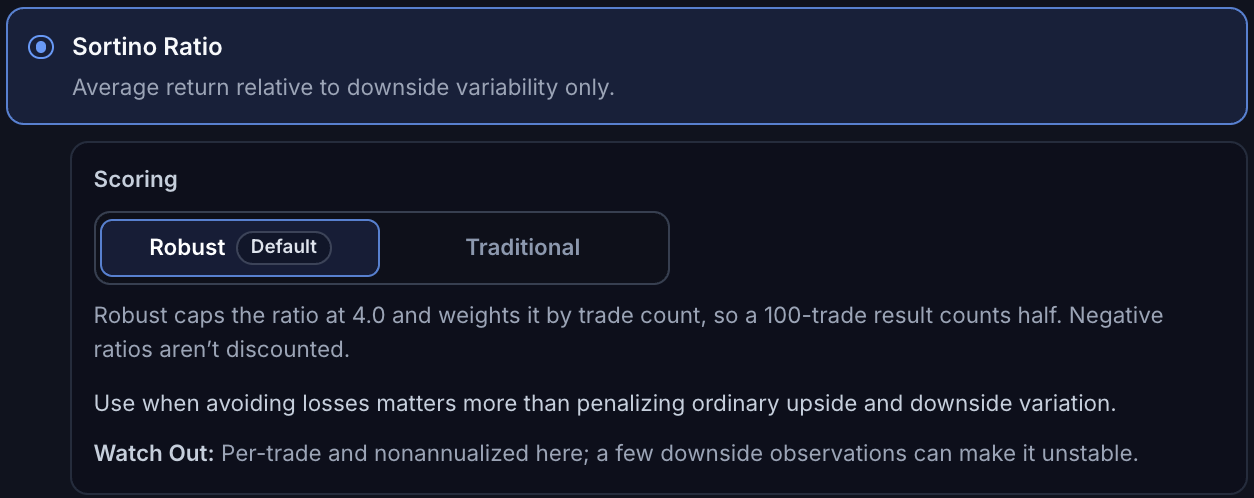
The help below Scoring explains how the selected method ranks trials. Here, Robust caps positive ratios at 4 and weights them by trade count. Select the image to open it at full size.
See How Rankings Can Change
Suppose two configurations, A and B, use the same data and the Sortino calculation. Both meet Minimum Trades. At the default confidence settings:
| Measure | A | B |
|---|---|---|
| Raw Sortino ratio | 2.4 | 1.4 |
| Trades | 40 | 100 |
| Traditional score | 2.4 | 1.4 |
| Robust score | about 0.33 | 0.70 |
Traditional ranks A higher. Robust ranks B higher, because B has more trades: the weight is about 0.14 at 40 trades and 0.5 at 100 trades. With 100 trades, A's ratio of 2.4 would give a Robust score of 1.20 instead of about 0.33. Neither ranking proves which strategy will perform better in the future. The two methods use different definitions of “best.”
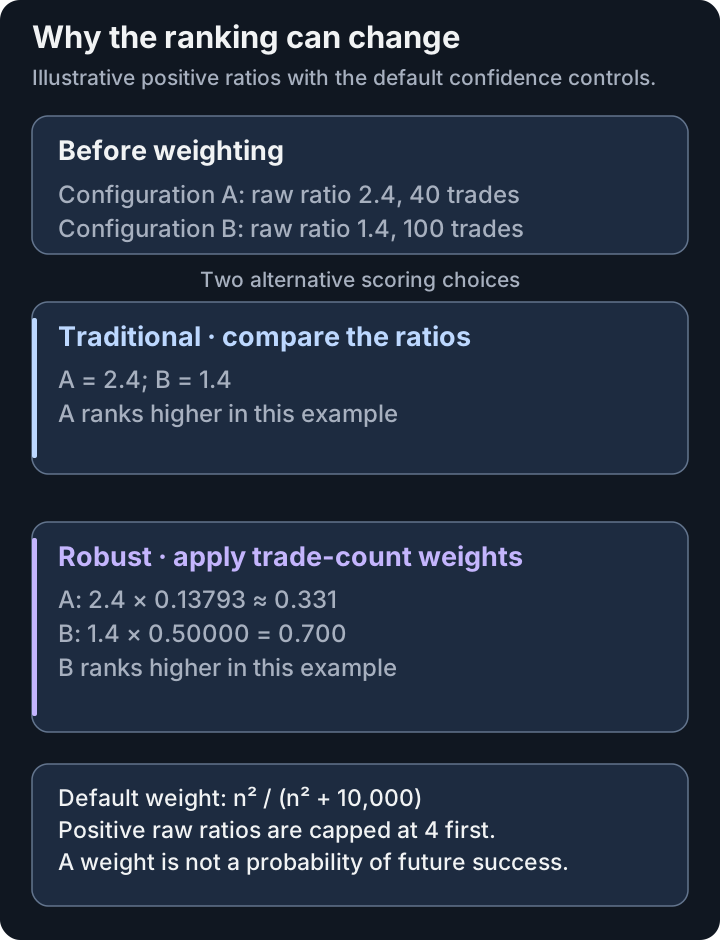
The same raw ratios can rank differently after trade-count weighting. These invented configurations explain the formula; they are not measured strategies or confidence probabilities.
Do not compare a Robust score with a Traditional ratio as if they were on the same scale. A small Robust score is not, by itself, evidence that a strategy is good or bad.
Set a Minimum Trade Count
Minimum Trades is the number of closed trades a trial needs before it can be the winner. It applies to every objective and is separate from the Robust weight. A trial with fewer closed trades stays in your results but cannot be the winner.
To change it, select Minimum Trades under Run Settings on New Study. The default is 10. You can enter a value from 1 to 100. If you raise the number, the study can end with no eligible winner. Raising it does not make the script generate more trades.
Results also rate the winner's trade count with the Trade Count trust signal, for example Enough trades to trust (15 or more). The signal uses the Trade Count threshold under Metric Colors in Studio Settings, 15 trades by default. That rating does not change which trials are eligible.
When you choose Traditional scoring and Minimum Trades is below 30, Optimization Goal shows a note under Scoring with a Set Minimum Trades to 30 button. Choosing Traditional does not change your count by itself.
- To change the count to 30, select the button. Then check that Minimum Trades under Run Settings reads 30.
- To keep your count, or to use another number, leave the button alone. You can edit Minimum Trades yourself.
Selecting the button does not start the study.
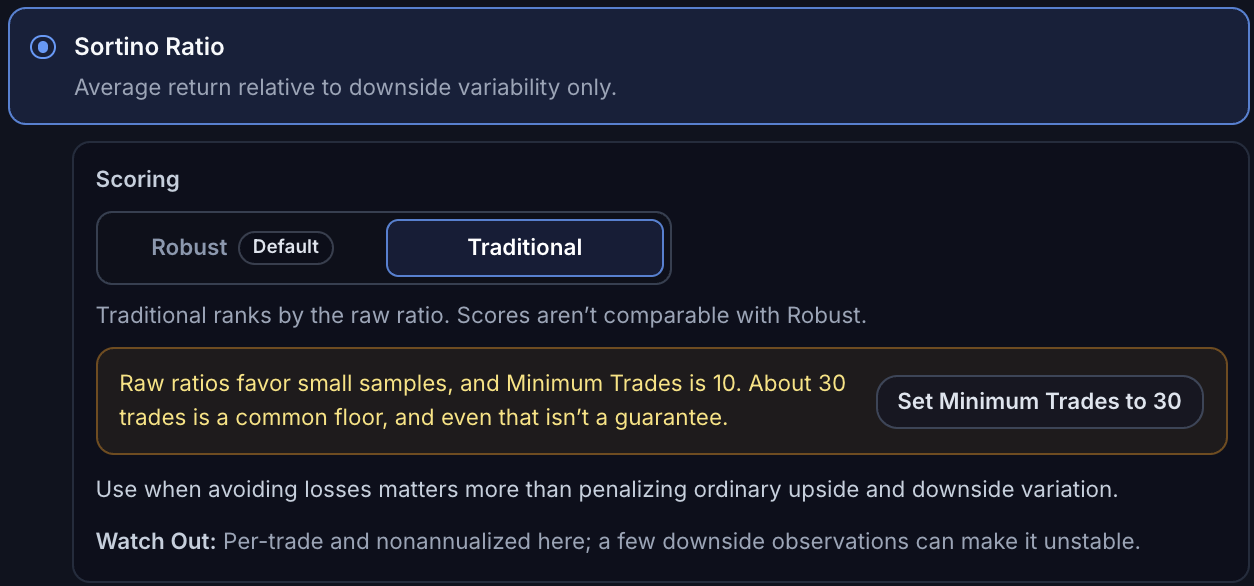
With Traditional selected, the note offers Set Minimum Trades to 30. The count changes only when you select the button. Thirty trades is a starting point, not a reliability guarantee. Select the image to open it at full size.
Trial Evaluation, also under Run Settings, sets how much of your data each trial sees. Full-Fidelity is the default and runs every trial on all your bars. Early Pruning stops weak trials at 25% and 50% of the bars and checks Minimum Trades at each checkpoint. A score at a checkpoint reflects only part of the data.
The first-study exercise keeps Minimum Trades at 10 and Trial Evaluation on Full-Fidelity. It runs five trials. To run five trials, select Custom in Number of Trials and enter 5.
Work Through the Calculations
This section shows how the app calculates the scores. You can choose an objective and run a study without it.
A Sortino or Sharpe ratio on this page does not always match a ratio with the same name in another tool. For optimization objectives, the app calculates both ratios from per-trade returns (one return for each trade). It does not annualize them (convert them into a yearly figure). Another tool may use daily, monthly or annualized returns. A return of 0.02 means a gain of 2%; −0.01 means a loss of 1%. Both ratios measure against zero: zero is the target return for Sortino and the risk-free return used by Sharpe.
Studio's strategy report uses monthly equity returns and the strategy's risk-free setting for its Sharpe and Sortino ratios. When the report has a complete, usable closed-trade path, these ratios use realized equity, which is built from closed trades only. Those report values can differ from the optimization objective even for the same strategy. Return Details explains that calculation and its data requirements.
First Calculate the Underlying Ratio
The formulas below use these symbols:
| Symbol | Meaning |
|---|---|
n | Number of trade returns; these ratio calculations need at least two. |
i | The index of a trade, from 1 through n. |
rᵢ | Return of trade i after its configured costs, as a decimal. |
μ | Mean (arithmetic average) of all trade returns. |
d | Downside deviation from zero, used by Sortino. |
s | Sample standard deviation of all returns, used by Sharpe. |
Σ | Add the indicated term for every trade, from i = 1 to n. |
min(rᵢ, 0) | Keep a negative return; replace a zero or positive return with zero. |
√ and ² | Square root and squaring, respectively. |
μ = (Σ rᵢ) / n

d = √[Σ min(rᵢ, 0)² / n]
Traditional Sortino ratio = μ / d

s = √[Σ (rᵢ − μ)² / (n − 1)]
Traditional Sharpe ratio = μ / s
The n − 1 in Sharpe is intentional: the scorer uses sample standard deviation. Sortino divides its downside sum by all n trades, not just the losing trades.
Worked example with four trade returns: +2%, −1%, +3%, −2%.
- Mean:
μ = 0.005, which is 0.5%. - Downside squares:
0,0.0001,0,0.0004. - Downside deviation: divide their sum by 4 and take the square root:
d ≈ 0.01118. - Sortino:
μ / d, about 0.4472. - Sample standard deviation:
s ≈ 0.023805. - Sharpe:
μ / s, about 0.2100.
This example only explains the arithmetic. Four trades would not meet the default Minimum Trades of 10.
Then Apply Robust or Traditional Scoring
At the default settings, the Robust weight is:
c = n² / (n² + 10,000)
Here c is the weight and n is the trade count. At 40 trades, c = 1600 / 11600 ≈ 0.13793; at 100 trades, c = 0.5.
In the formulas below:
Ris a finite raw Sortino or Sharpe ratio.qis that ratio after the numerical limits are applied.minchooses the smaller value andmaxthe larger.
q = max(−100, min(R, 100))
Traditional score = q

When q is zero or positive:
Robust score = min(q, 4) × c

When q is negative:
Robust score = q
Examples at 40 trades, where c ≈ 0.13793:
- A ratio of 2.4 scores
2.4 × 0.13793 ≈ 0.3310. - A ratio of 6 first becomes 4, then scores about 0.5517.
- A ratio of −0.5 stays −0.5. Robust does not weight a negative ratio: moving a negative number toward zero would incorrectly reward a smaller sample.
A cloud study ranked by Traditional Sortino alone uses a different rule for the Traditional score. See Numerical Limits and Trial Status.
Set Confidence Target Trades and Confidence Steepness under Trading Costs and Confidence in Optimization Goal. Their defaults are below; an assistant's prepare confirmation shows the resolved values. These controls apply to Robust Sortino and Sharpe; they do not replace Minimum Trades. The general formula is c = nᵏ / (nᵏ + tᵏ):
tis the trade count at which the weight reaches one half. The default ist = 100; the setting istarget_trades. A lower target gives the same trade count more weight.kcontrols how steeply the weight rises around the target. The default isk = 2; the setting issigmoid_steepness. These are scoring controls, not settings the search optimizes.
In a saved study configuration, canonical means Traditional. An older saved configuration that names no scoring method uses Robust.
Objectives Without a Scoring Choice
Profit Factor, Win Rate, Raw Net Return, Maximum Drawdown, Deflated Sharpe Ratio, Omega Ratio, Recovery Factor and Calmar Ratio do not use Robust or Traditional scoring, and the trade count does not reduce their score. Minimum Trades still applies.
- Some scores are capped. The ranking limits Profit Factor, Omega Ratio, Recovery Factor, Calmar Ratio and Raw Net Return to the range −99.999999 to 100, so a larger value ranks as 100. A profitable result with no loss to divide by also scores 100, for example a Profit Factor with no losing trades. The statistic shown on Results can be larger than the score.
- Maximum Drawdown ranks a lower drawdown first. The Optimizer ranks by the negative of the drawdown, and the app shows the drawdown as a positive loss.
- Deflated Sharpe Ratio runs from 0 to 1. It is an estimate, not a calibrated probability that a strategy works. It adjusts for the study's planned number of trials and assumes those trials are independent.
- Omega Ratio uses the target
τthat you set:Σ max(rᵢ − τ, 0) / Σ max(τ − rᵢ, 0). - Calmar Ratio annualizes growth over the scored trading period, so a short period can exaggerate it. On Signal Returns, it compounds the per-trade returns. On Executed Trades, it uses realized account growth from the first closed trade's entry to the last exit.
Numerical Limits and Trial Status
Two labels can appear in place of a score. They stand for stored marker values, which are not returns or percentages.
| Shown in the App | Stored Value | Meaning |
|---|---|---|
| N/C | −100 | Not Computable. The objective is undefined for the trial's closed trades: for example, a Sharpe with zero variation. |
| Ineligible | −101 | The trial completed with fewer closed trades than Minimum Trades. In cloud studies ranked by Traditional Sortino alone, a trial whose Sortino has no finite value is also Ineligible, for example one with no losing trade or with fewer than two closed trades. It cannot be the winner. |
Failed and pruned trials have their own statuses. A negative score alone does not mean that a trial failed.
The numerical limits for Sortino and Sharpe apply even in Traditional:
- A finite ratio is kept within −100 through 100. A per-trade Sortino cannot fall below −1. A Sharpe can fall below −100 when a few losing trades have nearly equal returns. That Sharpe is stored as −100.
- A stored −100 therefore has two possible meanings: the ratio could not be computed, or a valid ratio was limited to −100. The value alone does not show which case it is, and the app can show N/C for both.
- A positive infinite ratio becomes 100 in Traditional, or 4 before weighting in Robust. For example, Sortino is infinite when the mean is positive and no trade lost.
- An all-zero return series gives a Sortino of zero. A Sharpe with zero variation cannot be computed.
Cloud studies ranked by Traditional Sortino alone follow a stricter rule:
- A finite ratio is kept as it is, without the limit of 100.
- A trial with no losing trade has no finite Sortino, so it is marked Ineligible and cannot be the winner. This includes a trial whose trades are all flat.
- A trial with fewer than two closed trades is also marked Ineligible.
Studies that run in this browser, and studies with more than one objective, use the limits in the first list.
Read and Compare Scores
On the results page, Studies, comparisons and downloads, check the full objective label before comparing numbers. The selected objective is the optimization target. Win rate, drawdown, profit factor, raw ratio and trade count are additional diagnostics; none automatically replaces that target. Review an individual trial to see its values and context.
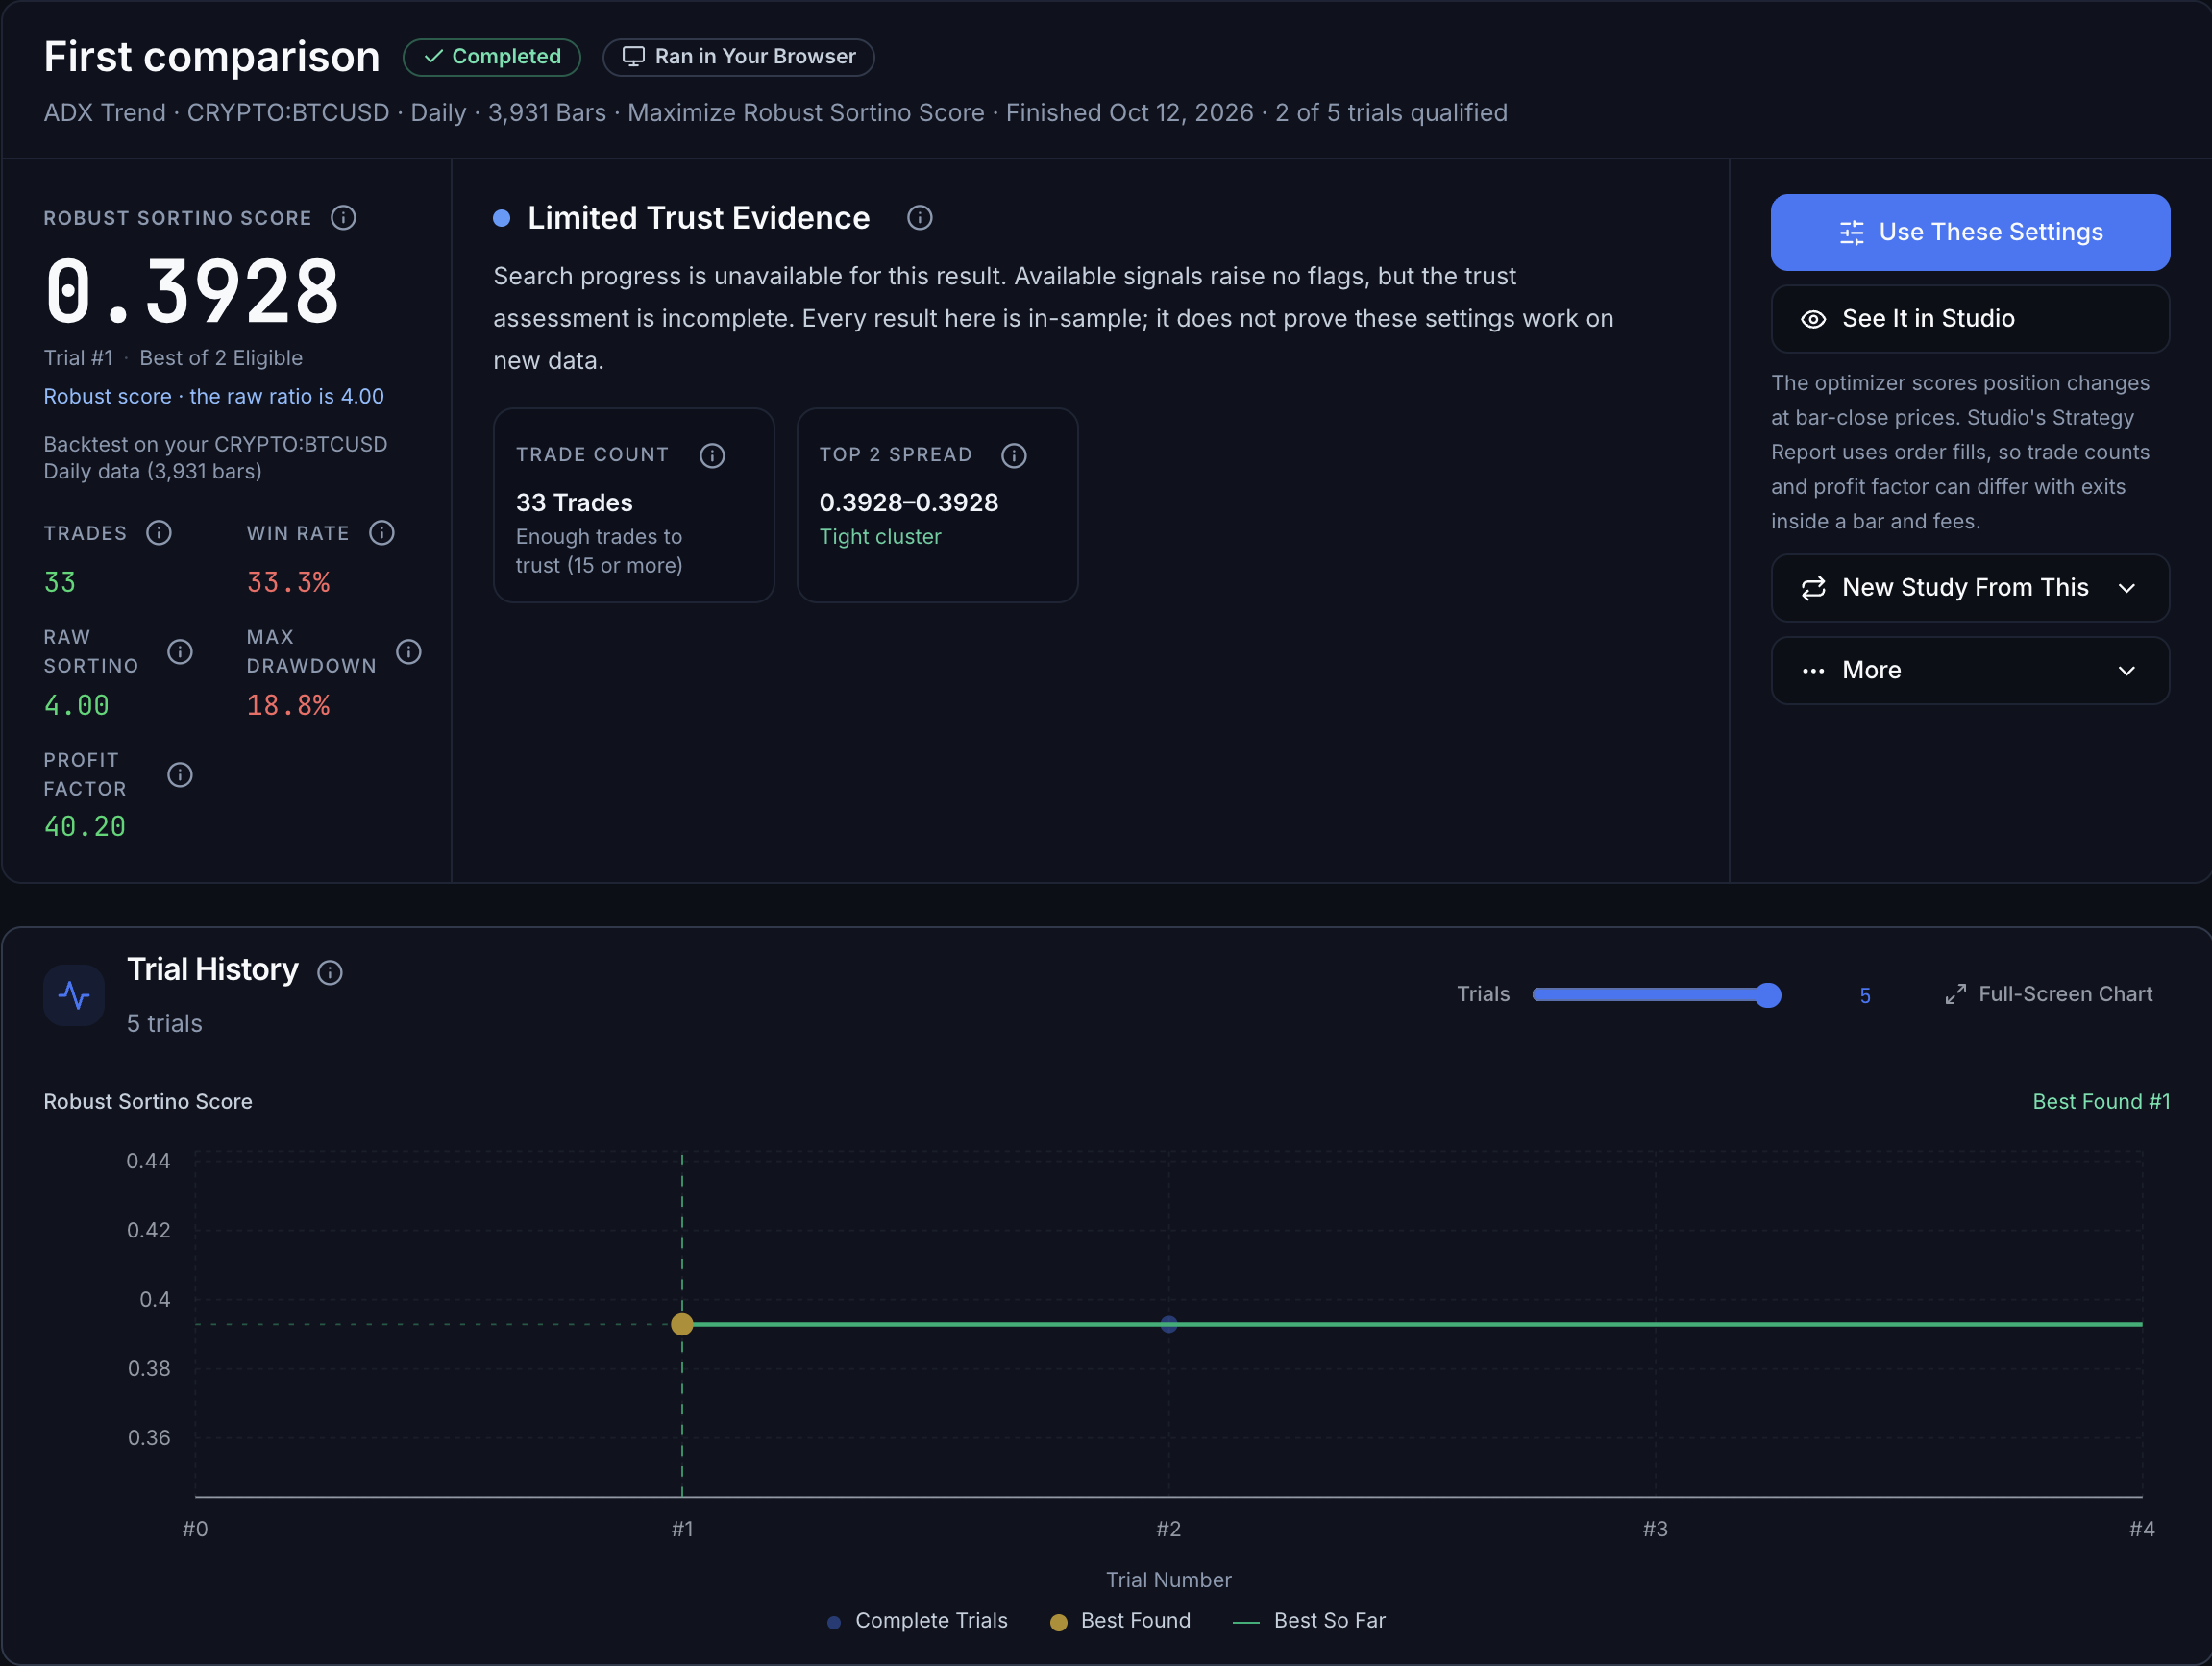
The results keep the full score label, here Robust Sortino Score. Check the trial status as well as the number: a negative score on a completed trial does not mean that the trial failed. Select the image to open it at full size.
A study keeps the scoring method it ran with. For a Robust study, Results helps you see the ratio behind the score:
- The line Robust score · the raw ratio is … appears under the score.
- A Raw Sortino or Raw Sharpe figure appears among the statistics. It is the same ratio as the line above: the best trial's ratio after the cap of 4 but before the trade-count weight, so 4.00 can stand for any ratio of 4 or more.
- The help icon beside the score label explains how the score was calculated.
On Studies and in other study lists, a positive Robust score can be followed by an approximate ratio in parentheses, such as 0.3310 (~2.4). Treat that value as an estimate. The app divides the Robust score by the weight, and that gives only the capped ratio: if the original ratio was above 4, its exact value cannot be recovered from the Robust score alone.
Compare the scores of two studies only when all of these match:
- the objective and, for Sortino and Sharpe, the scoring method (Robust or Traditional)
- the Omega target, when the study uses Omega
- Minimum Trades
- the confidence controls, when the study uses Robust Sortino or Robust Sharpe
- the scoring basis and, on Signal Returns, the Signal Round-Trip Cost
- the simulation assumptions
Even then, different data, ranges or strategy Properties can make a comparison misleading.
To test whether a result holds up, use unseen data: price history that did not guide the search. If you tune again and again against the same “unseen” data, that data becomes part of the search too. No objective or scoring method prevents overfitting or guarantees future profitability.
Compare With TradingView Carefully
A matching metric name does not guarantee a matching value. When comparing Studio's Strategy Report with TradingView, align the exact script and inputs, symbol, timeframe, price history, testing period and warm-up window. Then check initial capital, sizing, commission, slippage, order timing and the assumptions used to fill orders inside a candle.
An optimizer score on Signal Returns uses per-trade returns at bar-close prices. It does not simulate order fills, sizing, commission or slippage, so treat it as a separate measurement. An Executed Trades score uses Studio's own order simulation, which can still differ from TradingView's. See Check What the Study Scores. Compare the same metric definition too: per-trade versus monthly returns, closed profit versus Total P&L including open positions, and the same drawdown amount and percentage base. If results differ, compare individual entries and exits before interpreting the headline score.
How Impact Is Calculated
Impact is the share, out of 100%, that Optimizer gives each searched setting in a parameter-importance analysis of a finished study. Optimizer calculates it from the study's own trials with a method called PED-ANOVA. The analysis compares the study's best-scoring trials with all of its scored trials. A high Impact means that the setting's values set the best results apart. Impact does not say which values score best.
Where Impact Appears
- Settings on the results page shows an Impact percentage and bar for each searched setting, with the highest Impact first. Each bar is drawn relative to the largest share.
- The What Mattered trust signal names the two settings with the highest Impact and adds their shares together.
- Parameter Landscape opens on the two numeric settings with the highest Impact.
- Analysis Details, inside About This Study at the bottom of the results page, lists up to eight stored shares under Parameter Importance, to one decimal place.
When Optimizer Calculates Impact
Optimizer calculates Impact once a study finishes. It uses the study's scored trials: completed trials with a real score. Trials scored N/C or Ineligible are left out, and so are pruned and failed trials. A stored −100 can also be a valid ratio limited to −100. When the trial's record shows that, the trial counts toward Impact, even though Results shows N/C for it. When the record does not say which case it is, the −100 is left out as N/C.
The analysis needs at least five completed trials with a real score. A finished study with fewer has no Impact analysis.
How the Main Figure Is Calculated
Optimizer uses the PED-ANOVA method from the open-source Optuna library, version 4.4.0, with Optuna's default settings. The method is described in the paper PED-ANOVA: Efficiently Quantifying Hyperparameter Importance in Arbitrary Subspaces.
- Optimizer ranks the scored trials and takes the highest-scoring 10%, rounded up. The group always has at least two trials, and every trial tied with the cut-off score joins it. For Maximum Drawdown, the highest score is the smallest drawdown.
- For each searched setting, Optimizer estimates how the setting's values are spread among the trials in that group, and how they are spread among all scored trials.
- The more the two spreads differ, the larger the setting's importance. A setting whose values in the group look like the study as a whole gets close to zero.
- Optimizer scales the results so that the shares of all searched settings add up to 100%. Settings rounds each share to a whole percentage.
For example, suppose most of the best trials used a Trend Length between 150 and 200, while the study tested Trend Length from 10 to 300. Trend Length then gets a high Impact. That tells you the best results came from a narrow part of its range. Use Parameter Landscape to see which part.
If every setting gets the same share, the analysis could not tell them apart, for example because the scores barely differed. Equal shares do not mean that every setting mattered equally. A fixed setting has no Impact, because no trial changed it.
Cross-Checks Optimizer Also Records
The help beside Impact says that tree-based, permutation and pruning-aware estimates are recorded as cross-checks. If a study has no PED-ANOVA shares, Settings shows the first of the hybrid, tree-based, permutation and pruning-aware shares that it has, and the help beside Impact names that method instead. The results page does not show the cross-checks as separate columns.
- Tree-based (MDI): Optuna fits a random forest of 64 decision trees that predicts the score from the settings. A setting's share is how much splitting the trials on that setting improves those predictions, averaged over the trees (mean decrease in impurity). It uses every scored trial, high-scoring and low-scoring.
- Permutation: for each numeric setting, how consistently the score rises or falls as the setting's value rises (the strength of the rank correlation, in either direction), minus the average strength after 100 random shuffles of the setting's values. A setting that is not a number gets 0. This check needs at least 10 scored trials.
- Pruning-aware: the same rank correlation, raised when some parts of a numeric setting's range were stopped by Early Pruning much more often than others. That comparison needs at least 20 completed and pruned trials. In a study without pruned trials, it is the plain rank correlation. A setting that is not a number, or a pruned study with too few trials to compare, gets a fixed middle value.
- Hybrid: the average of the PED-ANOVA, tree-based, permutation and pruning-aware shares, with equal weights, scaled to 100%.
Impact for Additional Objectives
In a study with more than one objective, Viewing: can switch Results to another objective. Optimizer then runs the same analysis on that objective's scores in the background, and Settings and What Mattered show the hybrid share for that objective. The help beside Impact then describes those shares without naming a method. On that objective's scores, every −100 is left out as N/C, because a trial's record describes only its primary objective's score. If that analysis is not ready, Results says that parameter importance is still being calculated and asks you to reload the page, and What Mattered waits for it rather than showing the primary objective's Impact. Run Again, Try Next and follow-ups still use the primary objective.
Estimated Impact
When a finished study has no stored analysis, the column reads Est. Impact. Optimizer then estimates each setting's share from the study's own scored trials, leaving out N/C and Ineligible trials:
- It groups the trials by the setting's value. A setting with 10 or fewer distinct values, or one that is not a number, gets one group for each value. A setting with more values is split into eight groups with about the same number of trials each.
- It measures how much of the score's variation lies between those groups rather than within them. Statisticians call this share eta squared.
- It scales the shares so they add up to 100%.
The estimate needs at least 10 scored trials and uses every one of their scores, high and low. The help beside Est. Impact calls it a guide, not a measurement. When there is neither an analysis nor an estimate, Settings says that Impact was not computed and lists the settings in the script's own order.
What Impact Does Not Tell You
- Which values are better. Impact has no direction. Use Parameter Landscape, or sort Configurations by the setting, to see which values scored well.
- What drives results on new data. Impact describes this study's backtests on this data and these ranges. It is not evidence that a setting will matter the same way on other data.
- How one study compares with another. The shares always add up to 100% within a study, so 40% in one study and 40% in another do not mean the same thing.
- How the search sampled. The search tests more values where earlier trials scored well, and a wider range gives a setting more room to differ. Both can change a setting's share.
- How settings work together. A setting can matter only in combination with another. Impact gives each setting one share, so a low share does not prove that a setting is safe to ignore.
- A stable answer from a small study. With few trials, the shares can change a lot after you run more.
Act on Impact
- Open Parameter Landscape. It starts on the two settings with the highest Impact. Look at which values score well and which score poorly.
- Keep searching the settings with high Impact. Try Next in Settings suggests a range for each searched setting.
- If a setting has low Impact and the landscape looks flat across its range, consider fixing it at a sensible value in your next study, so the search spends its trials on the other settings. Try Next never fixes a setting for you, because the analysis does not measure how settings work together.
- If the study had few trials, run more before you rely on the shares.
- Test the settings you choose on data that the study did not use.