Run a Study and Read Its Results
A study is a search for better Settings using a particular script, dataset, search space and objective. A trial tests one configuration inside it. The screenshots below follow Your First Study: ADX Regime Trend, Bitcoin daily sample data, five trials.
This page shows you how to:
- choose which settings a study searches and which stay fixed;
- read a score;
- follow a study while it runs and find it again later;
- review a trial and use its values;
- start the next study from a finished one, including a region you choose on the map.
For a guided walkthrough of a Results page, open Help & Guides in the sidebar and choose Take the Study Results Tour. Until you hide the offer, a Results page also shows Start Tour.
Fixed Values and Search Ranges
Use Settings to Optimize to choose which settings the study searches. On New Study, select the settings part of the study sentence to open it, for example all 3 settings. The panel lists the inputs your script declares. Each change applies at once. Select Done to close the panel. A range does not change your saved Settings configuration, which holds one set of values.
ADX Regime Trend declares three numeric inputs. The tutorial search leaves each on its declared range:
| Control | What it means | Tutorial example |
|---|---|---|
| Optimize with a lowest and highest value | Trials sample values in this range. | ADX Length 5 to 60. |
| Fixed beside a numeric parameter | Locks it to one editable value. | Not used in the tutorial. All three settings stay on Optimize. |
A script that declares a toggle also offers Optimize (test both), Off, or On for that input. This sample has none.
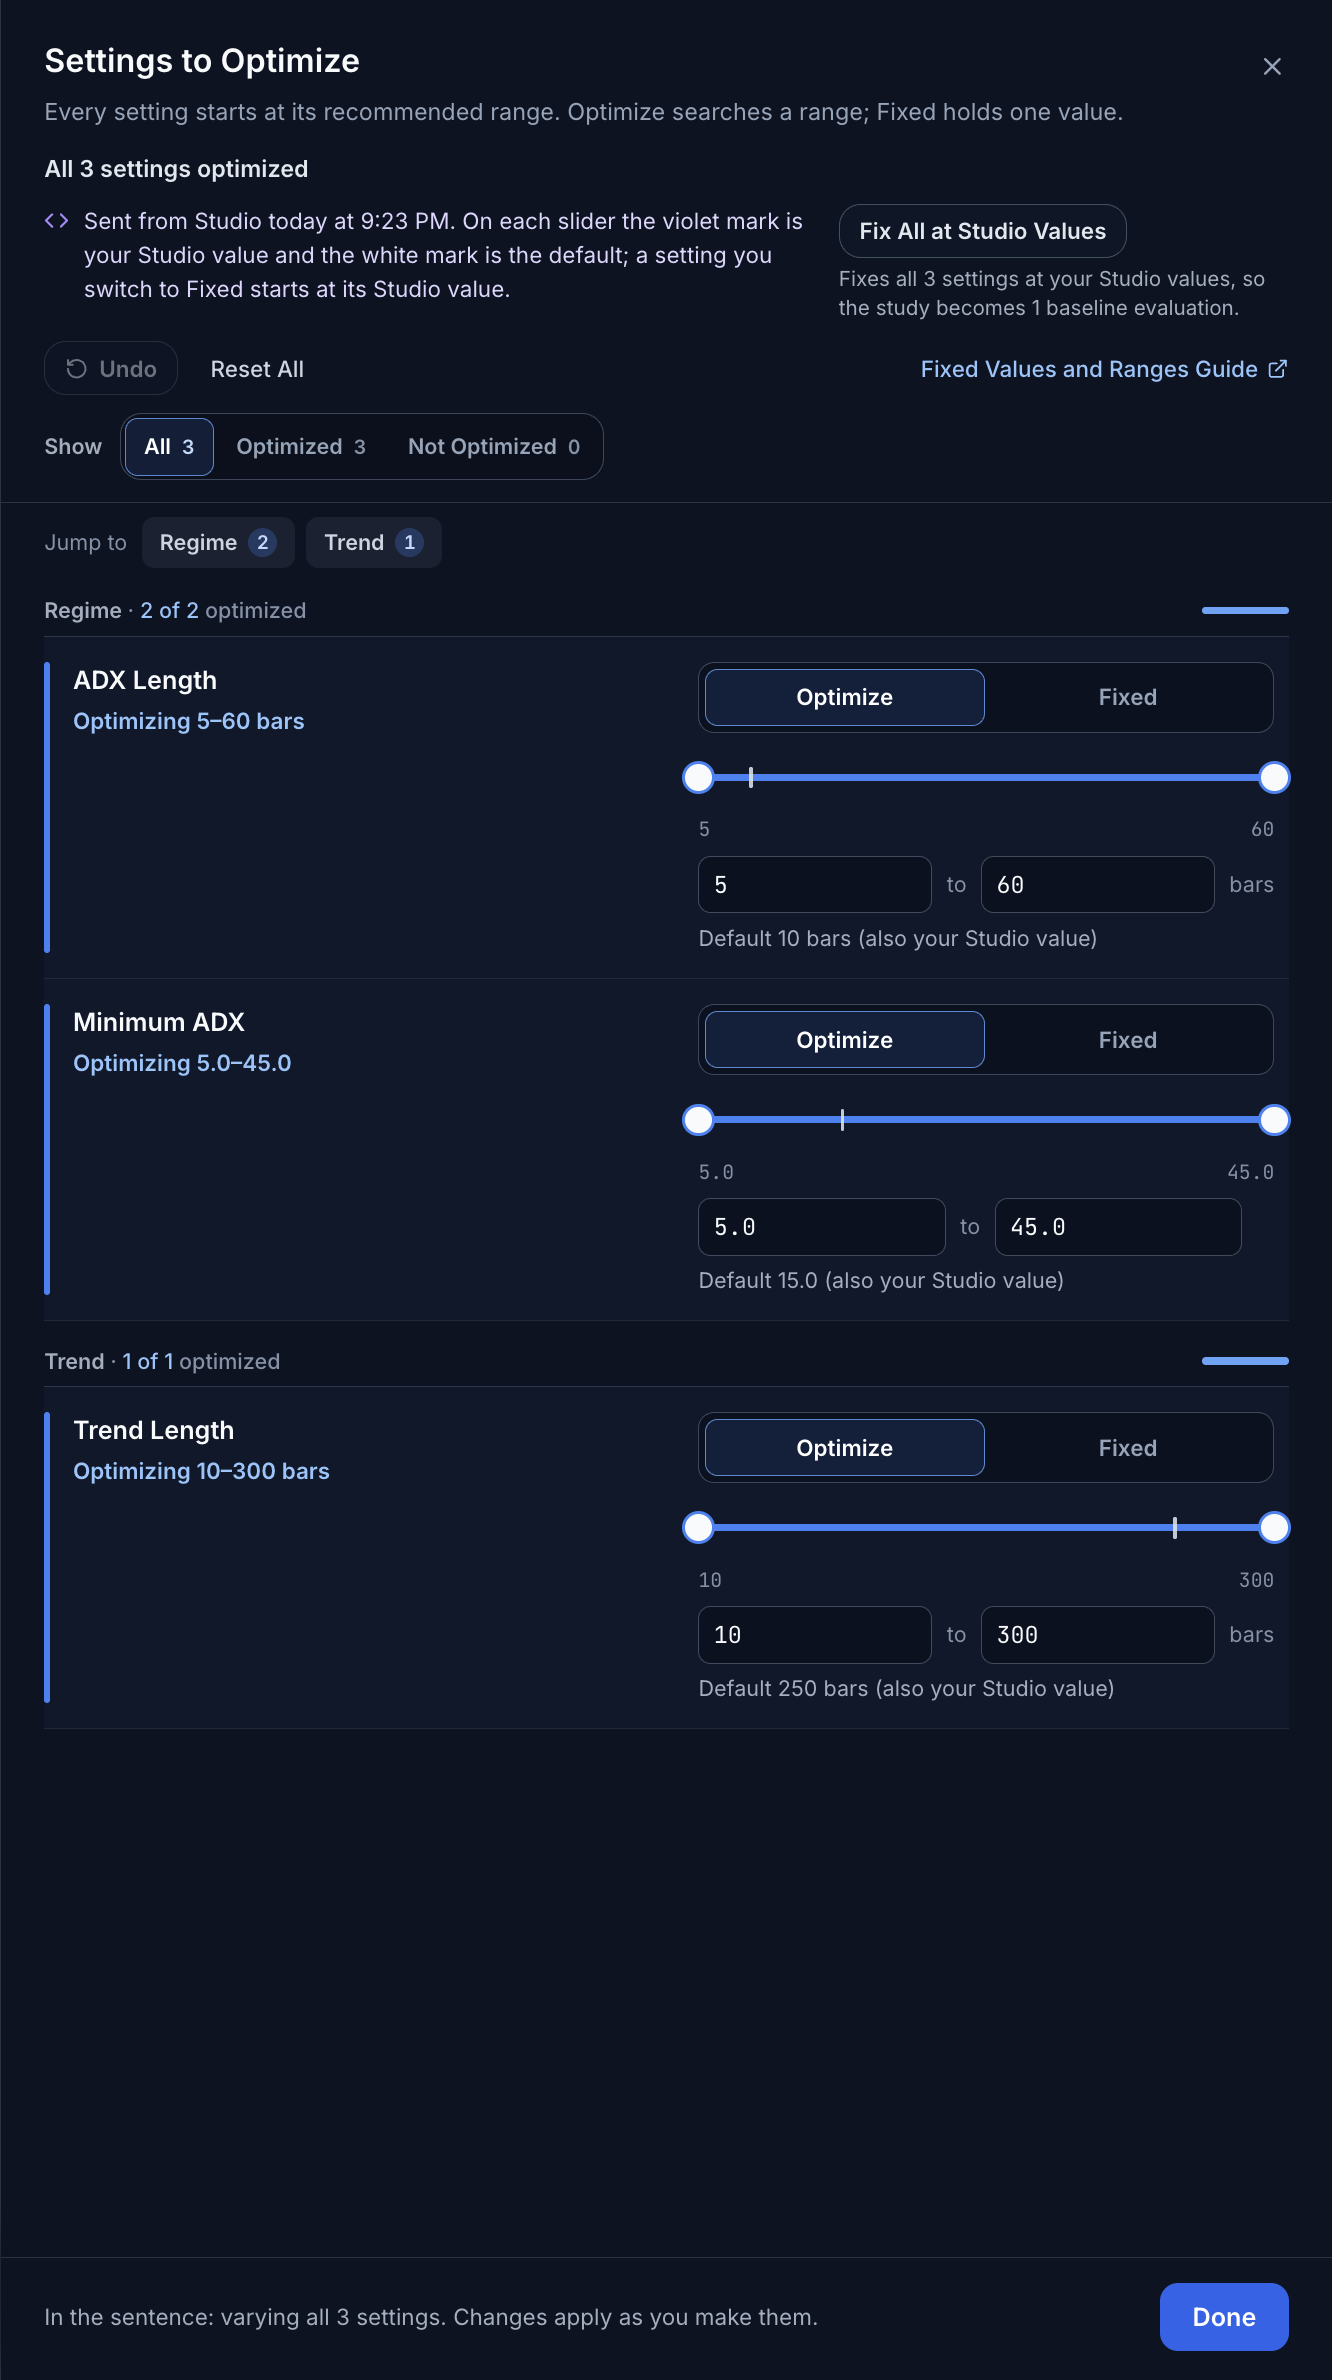
This is the tutorial search. Three numeric parameters vary. Choose Optimize to search a range or Fixed to hold one value. Select the image to open it at full size.
A fixed value is useful when you want to isolate one change. To compare ADX Length alone, leave its range open and set Minimum ADX and Trend Length to Fixed. To evaluate only the starting configuration, set all three to Fixed at 10, 15 and 250.
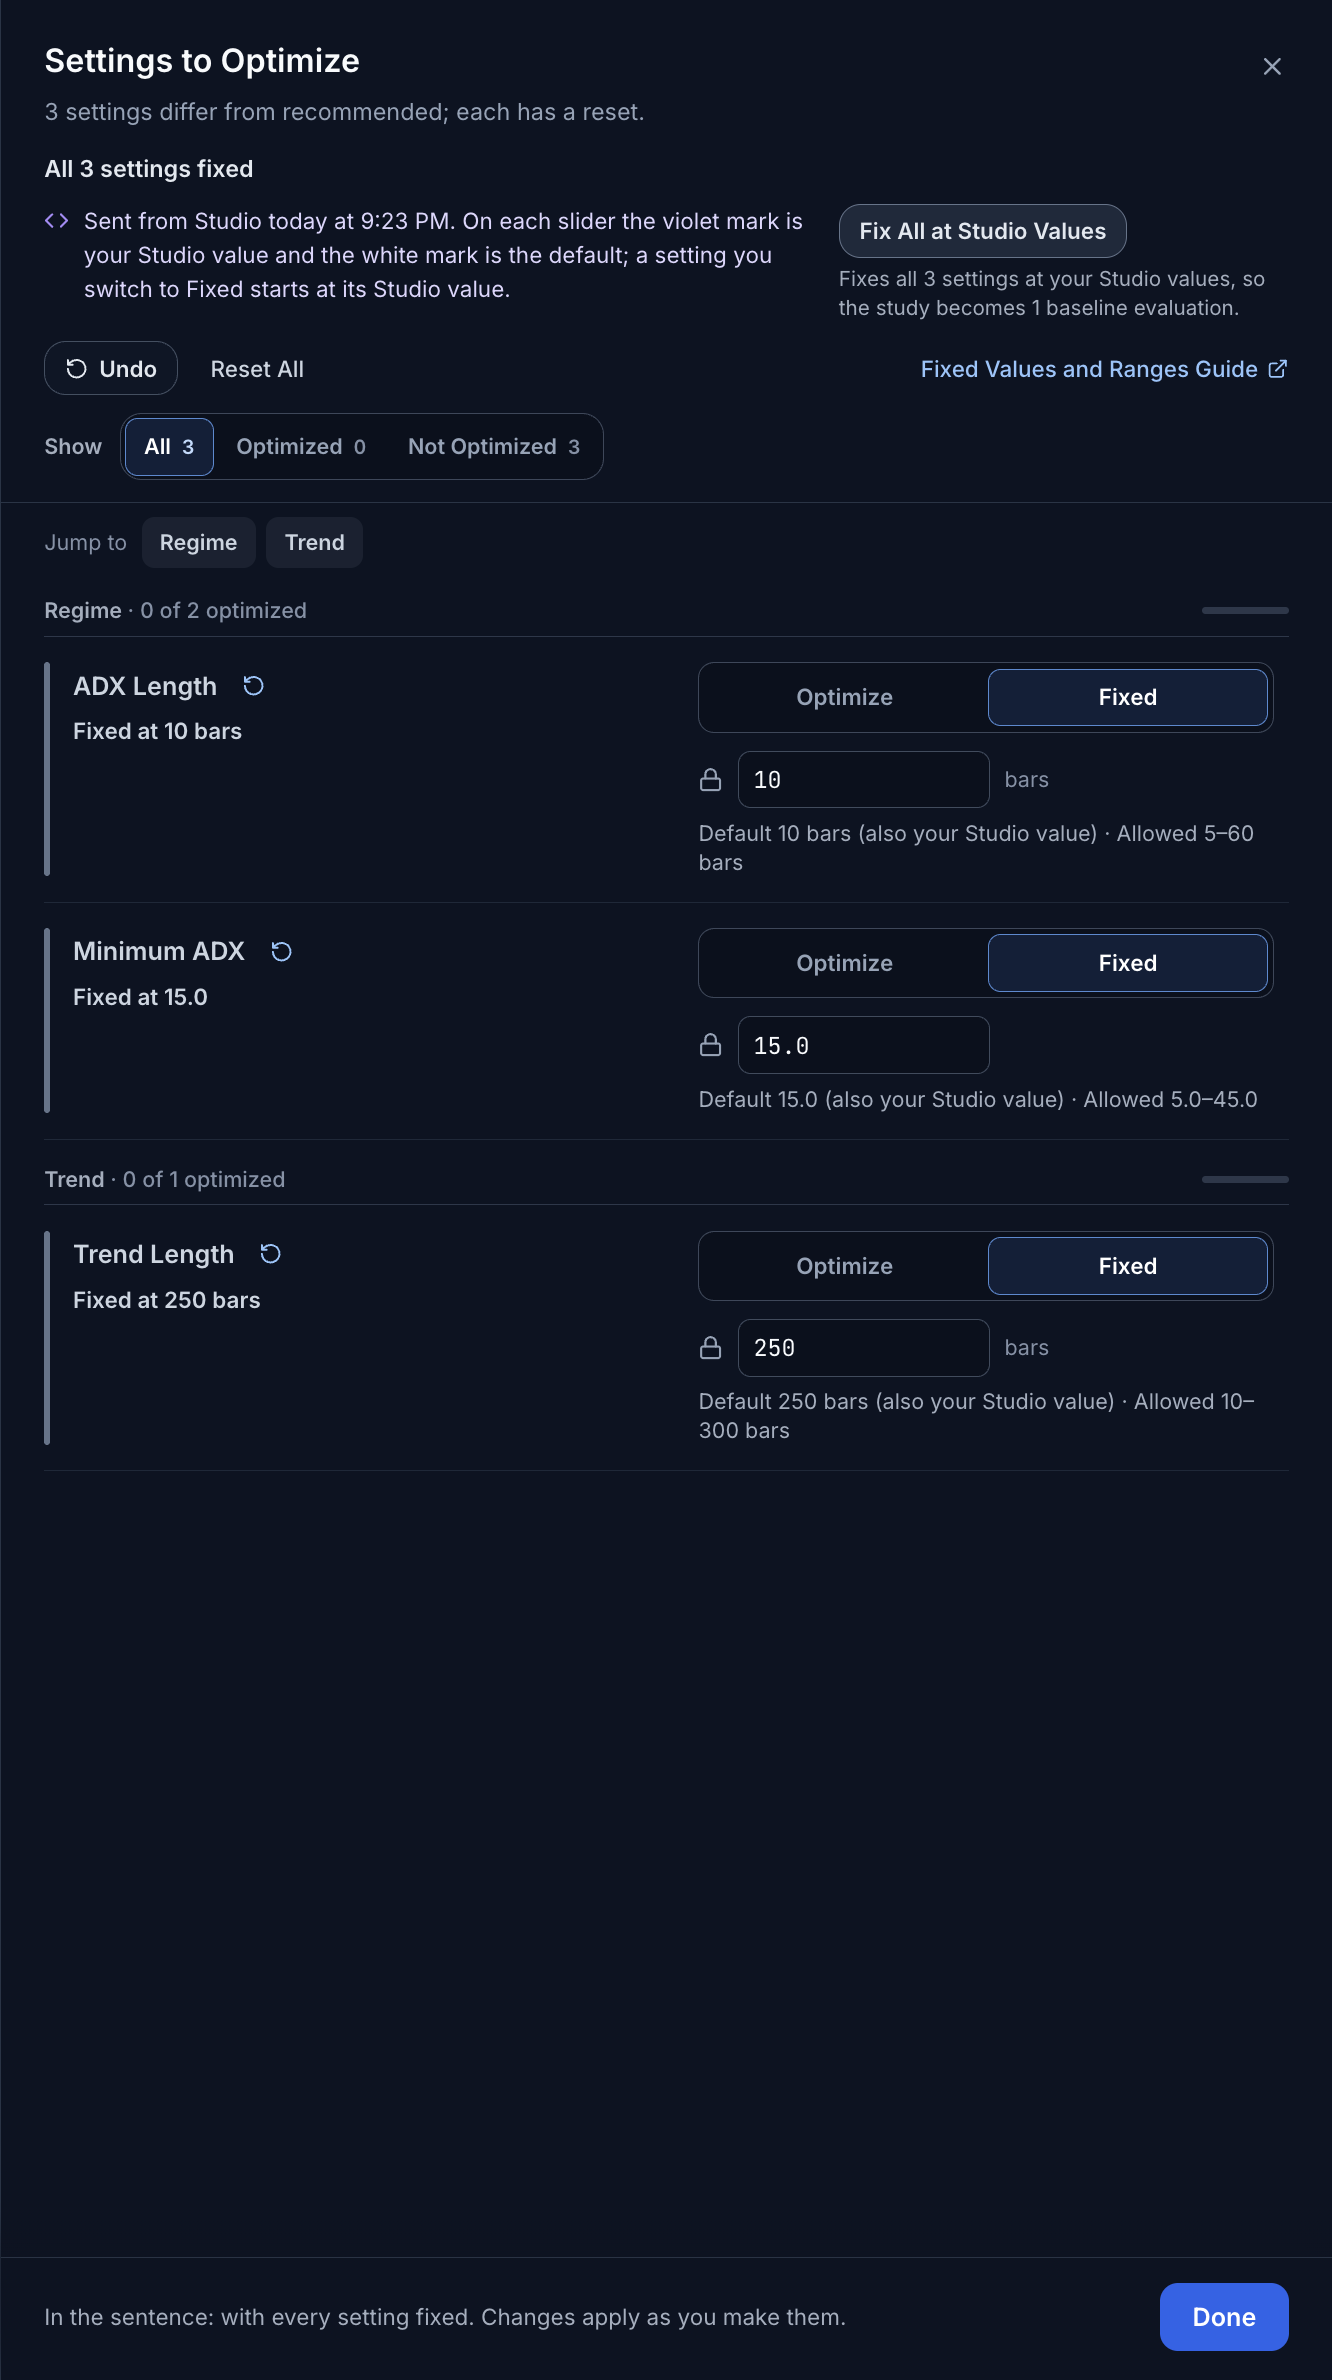
The fixed alternative runs one baseline evaluation. It is not the five-trial search above. To compare alternatives again, select Optimize beside a setting and choose its range. Select the image to open it at full size.
Four more things to know:
- The line at the top of the panel summarizes the search, for example All 3 settings optimized or 2 of 3 optimized · 1 fixed.
- When every setting is fixed, the start button reads Evaluate in This Browser, or Run Baseline Evaluation for a cloud study. The study then runs one evaluation, not a search.
- Changing a range does not overwrite a named Settings configuration. When you use a trial later, Studio saves that trial's values, not the range.
- A script with no adjustable inputs cannot be optimized. Add an input to the script in Studio first.
Settings That Start Fixed
Most settings start at their recommended range. Some start fixed; read the explanatory summaries above the controls for the reasons:
- Display Only marks a setting that only changes how the script draws on the chart. It starts at the script's value.
- A date input starts fixed at the script's date.
- A setting that the script's defaults never use, such as the settings of a switched-off feature, starts at the script's value.
- A very wide declared range starts near the script's default. Drag the ends of the slider to search wider.
You can change any of these before you start. To see what the study will search, use Show at the top of the panel: All, Optimized or Not Optimized. Undo reverses your last change, and Reset All discards all your changes in the panel.
When you come from Studio, each slider has two marks. The violet mark is the value you used in Studio, and the white mark is the script's default. A setting that you switch to Fixed starts at its Studio value. Fix All at Studio Values fixes every setting at once, so the study becomes one baseline evaluation.
Understand the Score
A score is the number the study uses to rank its trials. For the tutorial, a higher score is better. A negative score is a valid result. It does not by itself mean the software failed. To tell a completed trial from a failed one, read the trial's status.
An objective function is the formula that scores each tested configuration so they can be ranked. A trial backtests one set of values, receives a score, and contributes an observation that can guide the search. Changing the objective can change both the ranking and the configurations a new search favors.
On New Study, the sentence ends with the objective, for example rank them by Robust Sortino Score. Select the objective to open Optimization Goal, then choose an objective from the list. The objectives offered depend on your script. A new study starts on the objective marked Default. That is Profit Factor when your script offers it.
For Sortino Ratio and Sharpe Ratio, a Scoring control then chooses Robust, the default, or Traditional. Results name the combination: Robust Sortino Score, Traditional Sortino Ratio, Robust Sharpe Score or Traditional Sharpe Ratio. For your first study, choose Sortino Ratio and keep Robust scoring. The examples in this guide use that choice.
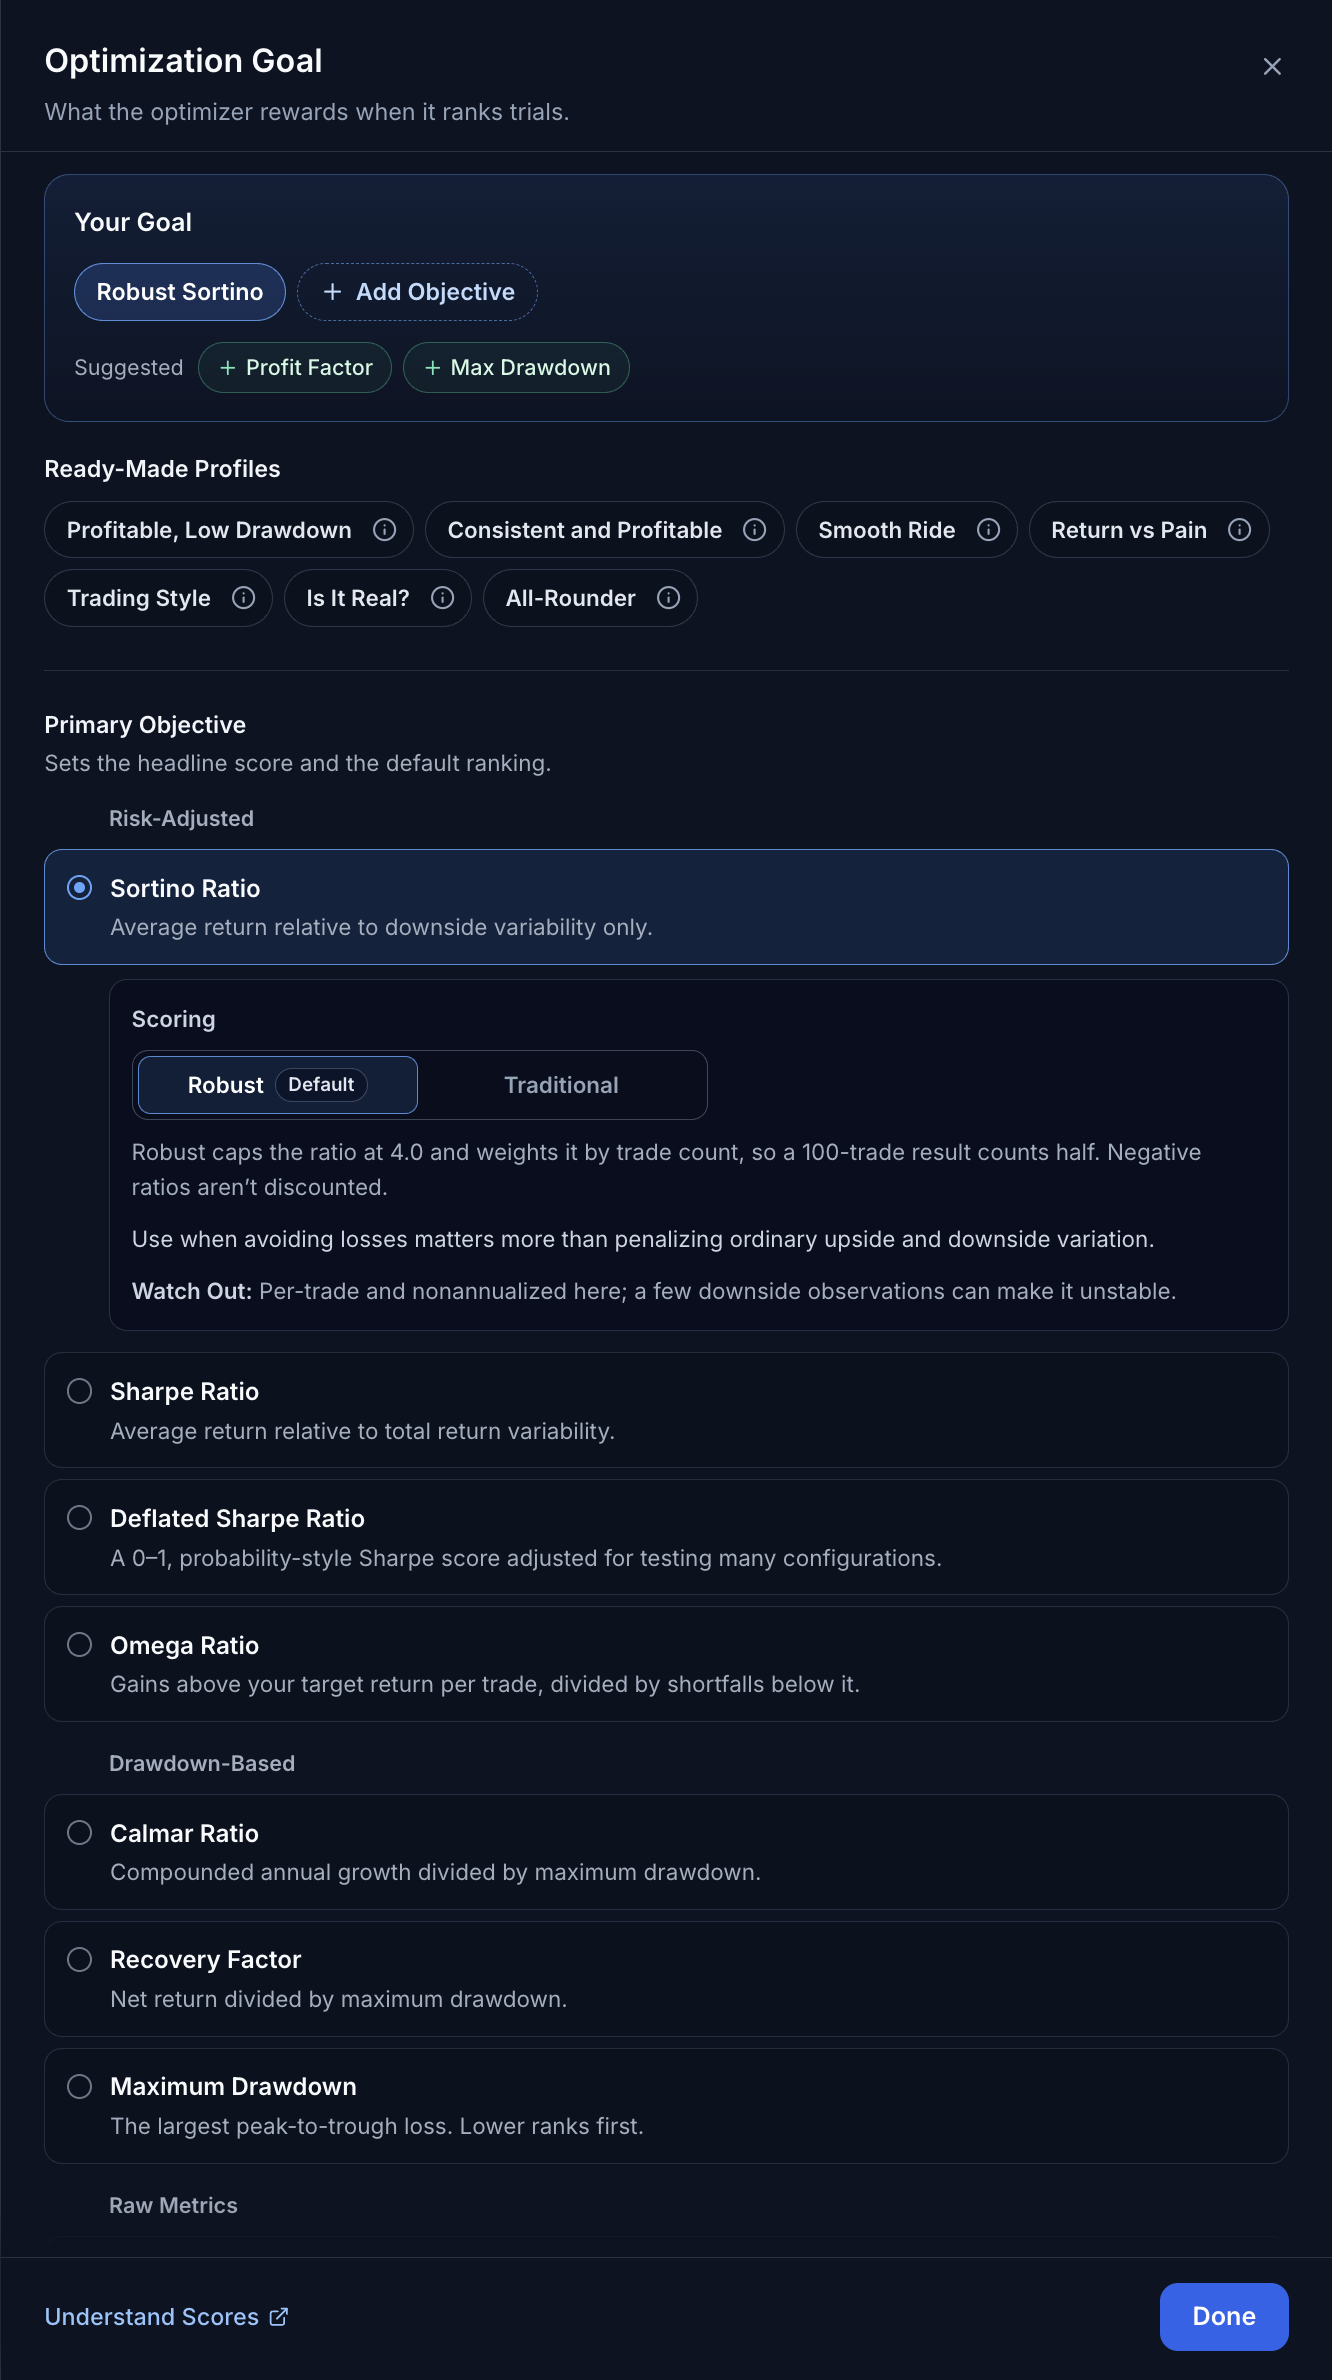
The selected objective expands to show its Scoring choice and guidance. Understand Scores at the bottom of the panel opens the full guide. Select the image to open it at full size.
Each of these four names has two parts:
| Word | What it means |
|---|---|
| Sortino | Compares the average return with downside variation. |
| Sharpe | Compares the average return with the variation in all returns. |
| Robust | Caps positive ratios at 4 and weights them by trade count. |
| Traditional | Leaves out those two adjustments. It still applies numerical limits. |
All four are calculated per trade and are not converted to a yearly figure. The trade-count weight is below 1, so a positive Robust score is smaller than its raw ratio. A small Robust score is not proof that a strategy is good or bad.
For the full explanation, read Objectives and Scores. That guide:
- explains why the objective matters and compares the choices;
- works through the formulas, for example how a raw ratio of 2.4 becomes a Robust score of about 0.33;
- explains the optional Set Minimum Trades to 30 suggestion;
- explains why Robust and Traditional headline values are on different scales;
- explains how the Impact of each setting is calculated.
Completed means the attempt finished. Eligible means it passes the study's ranking requirements, such as Minimum Trades. Best means it has the highest eligible score in this example. If no trial qualifies, there is no winner to apply. For the tutorial, use 5 trials, Minimum Trades 10 and Full-Fidelity. More trials explore more configurations; they do not guarantee a better strategy.
Monitor a Study
After you select Start in This Browser, the runner page opens. It shows:
- what the study is doing, for example Running In This Tab;
- Trial N of M with a progress bar;
- two counts, Finished In This Browser and Verified Trials. A trial is finished when your browser has run it. It is verified when the optimizer has checked its score and added it to your study.
While the study runs:
- Keep this browser tab open until your results sync, and do not reload it.
- You can use other parts of the app.
- To hold the run, select Pause, then Resume to continue.
- Before you close the tab, select Stop Running. Verified trials are kept. If the runner says the run can continue later, open the study again and select Resume Optimization.
- When the page says Checking Results, your browser has finished its part. The page says You can close this tab while the optimizer checks the scores.
- If the runner says Sign In Required, sign in again, then choose Resume. If it says Your account changed. Reopen the study in its original account to continue., switch back to the account that started the study.
If the tab closes by accident, the run stops, but results saved on this device are kept. Reopen the study to continue. Only one tab can run a study at a time. If the study is running in another tab, go back to that tab, or select Take Over In This Tab to move it here. If the closed tab still holds the run, wait about three minutes for its claim to expire, then try again.
The runner also draws a live Parameter Landscape. Each trial lands where it was tested, and the terrain forms once three trials have scores. If a trial's settings need more computation than one trial is allowed, the trial stops before it can be scored, and the landscape counts it as Ran Out Of Compute. Long lookbacks, such as a large Max Bars Back, are the usual cause.
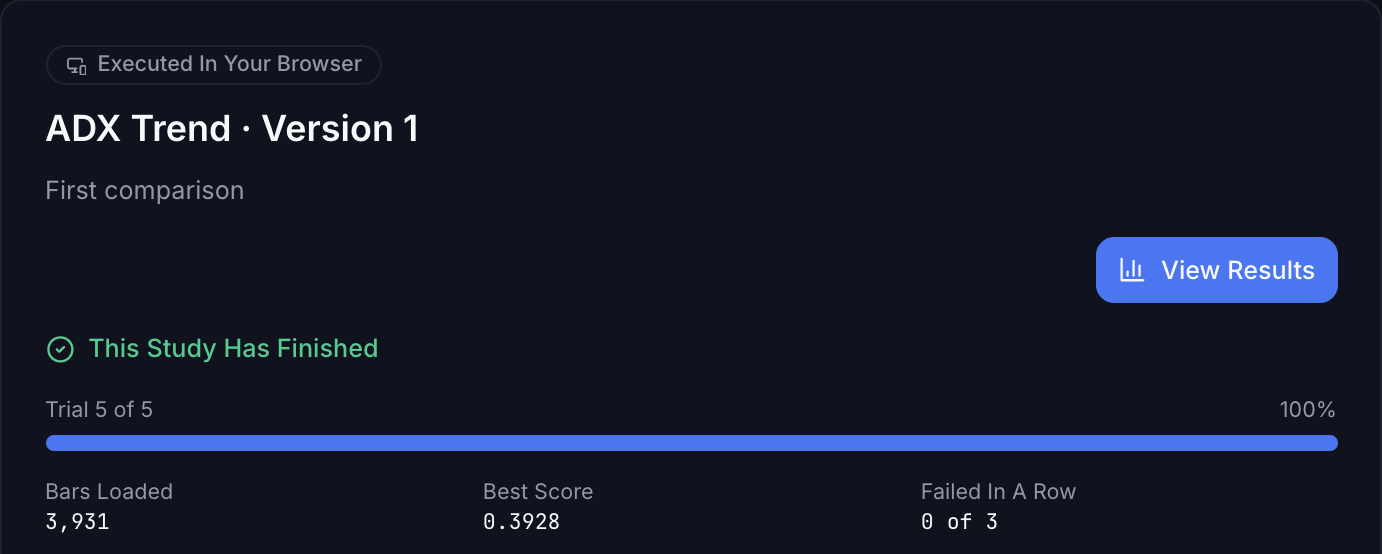
After a run reports Results Ready, you can return to it later. This reopened example says This Study Has Finished. Select View Results to open the saved results. Select the image to open it at full size.
You do not have to watch the page. When a study finishes or fails, the app shows a Study finished or Study failed message on the page you are on.
While this tab holds a browser run, a banner at the top of the other app pages shows its progress. Select Return To Optimization to go back to the runner page. When the run is complete, the button reads View Results instead. If the tab holds more than one run, for example after you use Parallel Runs, the banner has one summary row with their counts and combined progress. Select Show Runs to list each run with its own button, and Hide Runs to close the list. Dismiss Finished removes the runs that are complete or need attention, and shows how many there are. Runs that are still running or waiting stay, including paused and stopped runs.
Find a Study
Studies in the sidebar is one page for current activity and every study you have run. The Active Studies panel at the top shows queued, parked, running and paused studies, results being checked, and failures from the past 48 hours. Its controls depend on each study's state. The full list is below it.
To reopen the tutorial study:
- Select Studies in the sidebar.
- Type First comparison in Search studies.
- Select the study's title.
If a study seems missing, select Clear All Filters. Search needs at least two characters of a study's name or ID. Filters narrows the list by status, symbol, timeframe, strategy, freshness, study type or label. The tabs All, Active, Completed and Cancelled narrow the list by status. Cancelled also lists stopped studies. A Failed tab appears when a study has failed. Your Script Library is a different library: it stores source code. In Studio's script picker, it is the My Scripts tab.
A single evaluation that an AI assistant started does not appear on Studies. Ask the assistant for its results.
To arrange the list, open the Group By menu, shown as Group: on a wide screen. You can group studies by Market (symbol and timeframe), Market + Objective, Strategy, Parallel Run, Timeline, Symbol, Timeframe, Label or Follow-Up Family. None shows one flat list.
To work with several studies at once, select the checkbox beside each one. The bar that appears offers:
- Compare, for 2 to 4 finished studies. See Compare Studies.
- Label, which opens a dialog such as Label 3 Studies. Type a label, choose a Label Color, then select Apply Label. Every selected study gets this label, replacing any label it has now. Clear Labels removes the labels instead.
- Export, with Metrics as CSV or Settings as JSON.
- Pause, Stop, Resume or Delete, when the selected studies allow it.
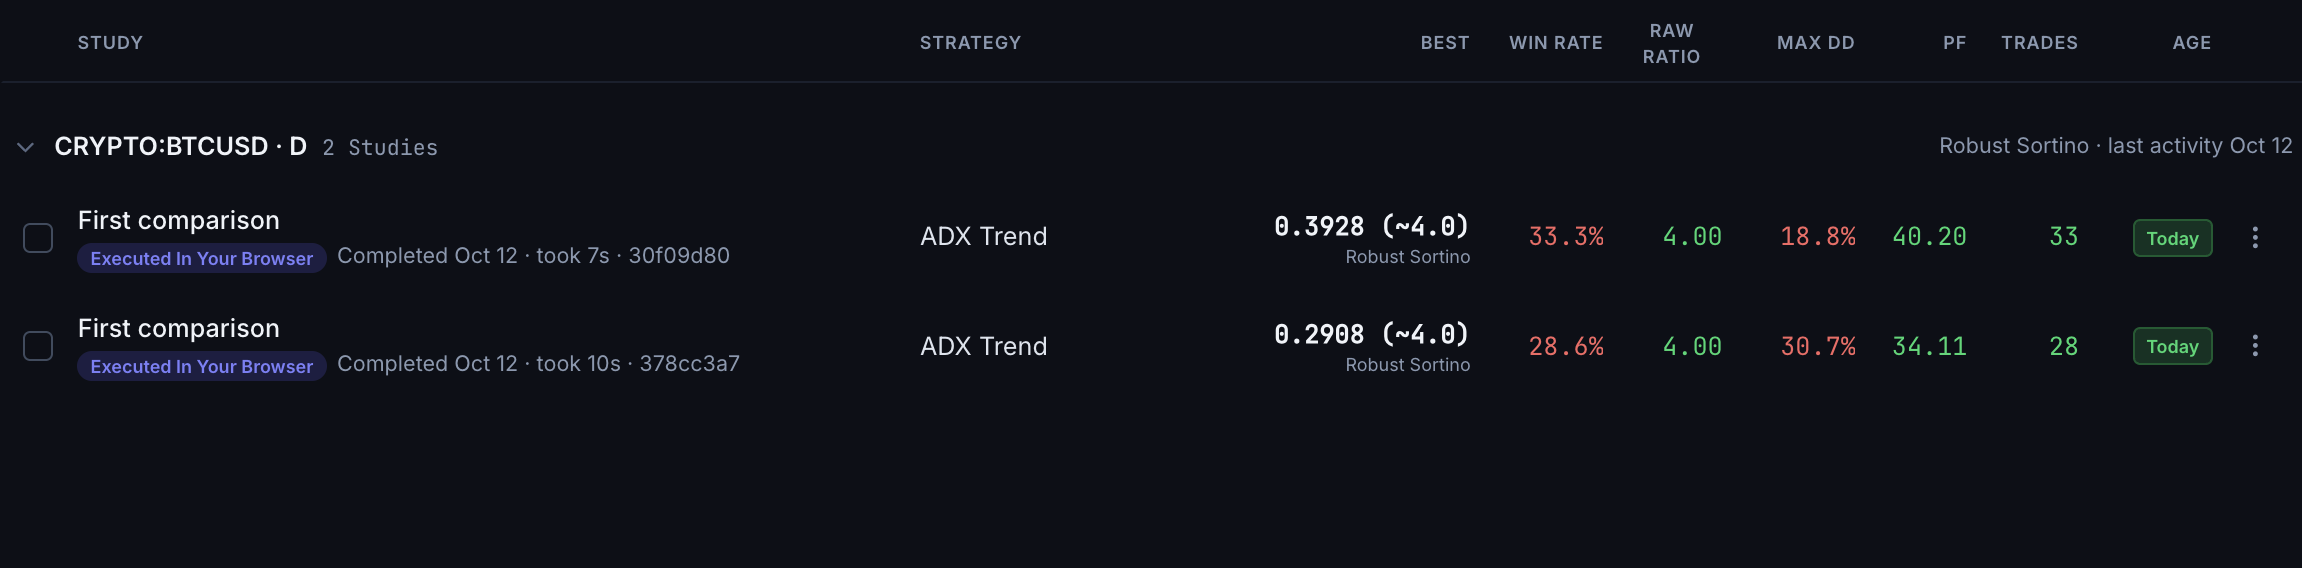
Search by study name to return to a study. This example shows two separate runs of First comparison. Open the run you want to inspect. A raw ratio, win rate and drawdown each describe a different aspect of the same run. None of them can stand in for the score. Select the image to open it at full size.
Read a Study's Status
| Status | What it means |
|---|---|
| Queued | Waiting to start. A cloud study starts when a worker is free; wait instead of retrying it. If Start Now appears, the study was not handed to a worker yet. |
| Parked | Waiting for your browser. Open the study to start or resume it. |
| Running | Trials are being tested. The best trial can still change. |
| Paused | The run is on hold. |
| Stopped | The run was stopped. Its verified trials are kept. Studies has no way to resume it; to search again, use Run Again or start a new study. |
| Completed | The run finished. |
| Failed | The run ended with an error. |
| Cancelled | The run was cancelled. |
While a study runs, results can be partial and the best trial can change. Actions that use the settings show Unlocks at the Finish until the study ends. A stopped or failed study can keep its completed trials.
Even when a run has finished, a study with no eligible trials has no ranked winner. The results page then says No Eligible Trials. Read the study's status, error and eligibility explanation before you start another study.
Check Whether Results Are Verified
Read the result message before you treat an empty list as a study with no trials.
| Result message | What it means |
|---|---|
| No Verified Results Yet | No trial has been checked yet. Results appear after the first check. |
| Checking Results | Browser trials are being checked. The list grows as checks finish. |
| Partial Results | The run has not finished. Every trial shown is verified. |
| Verified Results | The retained trial history has completed the study's verification checks. |
| Verification Stopped This Run | A trial failed its check, so only the trials verified before it are shown. Start a new run to continue. |
| Run Stopped or Run Interrupted | The run ended early. Only verified trials are shown. Read the status and error before you decide what to do. |
| Restoring Results | Some results are being restored from the saved record. The page refreshes on its own. |
| Results Unavailable | The results cannot be shown. This does not mean the study had no trials. Follow the message on the page. |
| Results Need a Newer Version | Refresh the page to load the latest app. |
Here, verified means the service checked the submitted results under the study's recorded rules. It does not certify your script, prove TradingView parity or establish future profitability. Failed and ineligible attempts remain different from ranked trials.
If the page says Results Could Not Be Loaded, select Retry Fetch. This is a loading error, not a sign that the study has no trials.
Compare Studies
To put studies side by side, select the checkbox beside 2 to 4 finished studies on Studies, then select Compare. If Compare is unavailable, the bar shows the reason. In each row of the comparison, the best value is green and the worst is red. When the studies differ in market, objective or scoring basis, no overall winner is named. Studies with different scoring bases are not ranked at all: each row says Different accounting: not ranked. Compare Studies in Detail explains the rules.
If you open Compare with no studies selected, Pick Studies to Compare explains what to do. If the page says Couldn't Load These Studies, select Try Again. A study that was deleted or has no final results is left out without a message, so check the study names shown. Remove [study] From Compare removes a study from the comparison only. It does not delete it.
Review a Trial
- Open the study. The header shows its name, its status, where it ran, the best score and a short verdict.
- Before you rely on the score, read the trust signals under the verdict: Trade Count, Top N Spread (how close the top scores are, for example Top 2 Spread) and Search Progress (whether the search was still improving). What Mattered names the two settings with the highest Impact.
- Read the objective and its direction in the line under the study name. This example shows Maximize Robust Sortino Score. A study ranked by Maximum Drawdown instead favors the lowest drawdown; read the direction rather than assuming that the largest displayed number wins.
- Use Trial History to see the completed trials in the order they ran. To add trials that were stopped early, select Pruned. The gold point is the Best Found trial, and the green Best So Far line tracks the best score as the study ran. A flat stretch of the green line means that no later trial beat that score. It does not, by itself, show that the search has settled. A trial number identifies an attempt; its rank describes where it placed. They are not the same number.
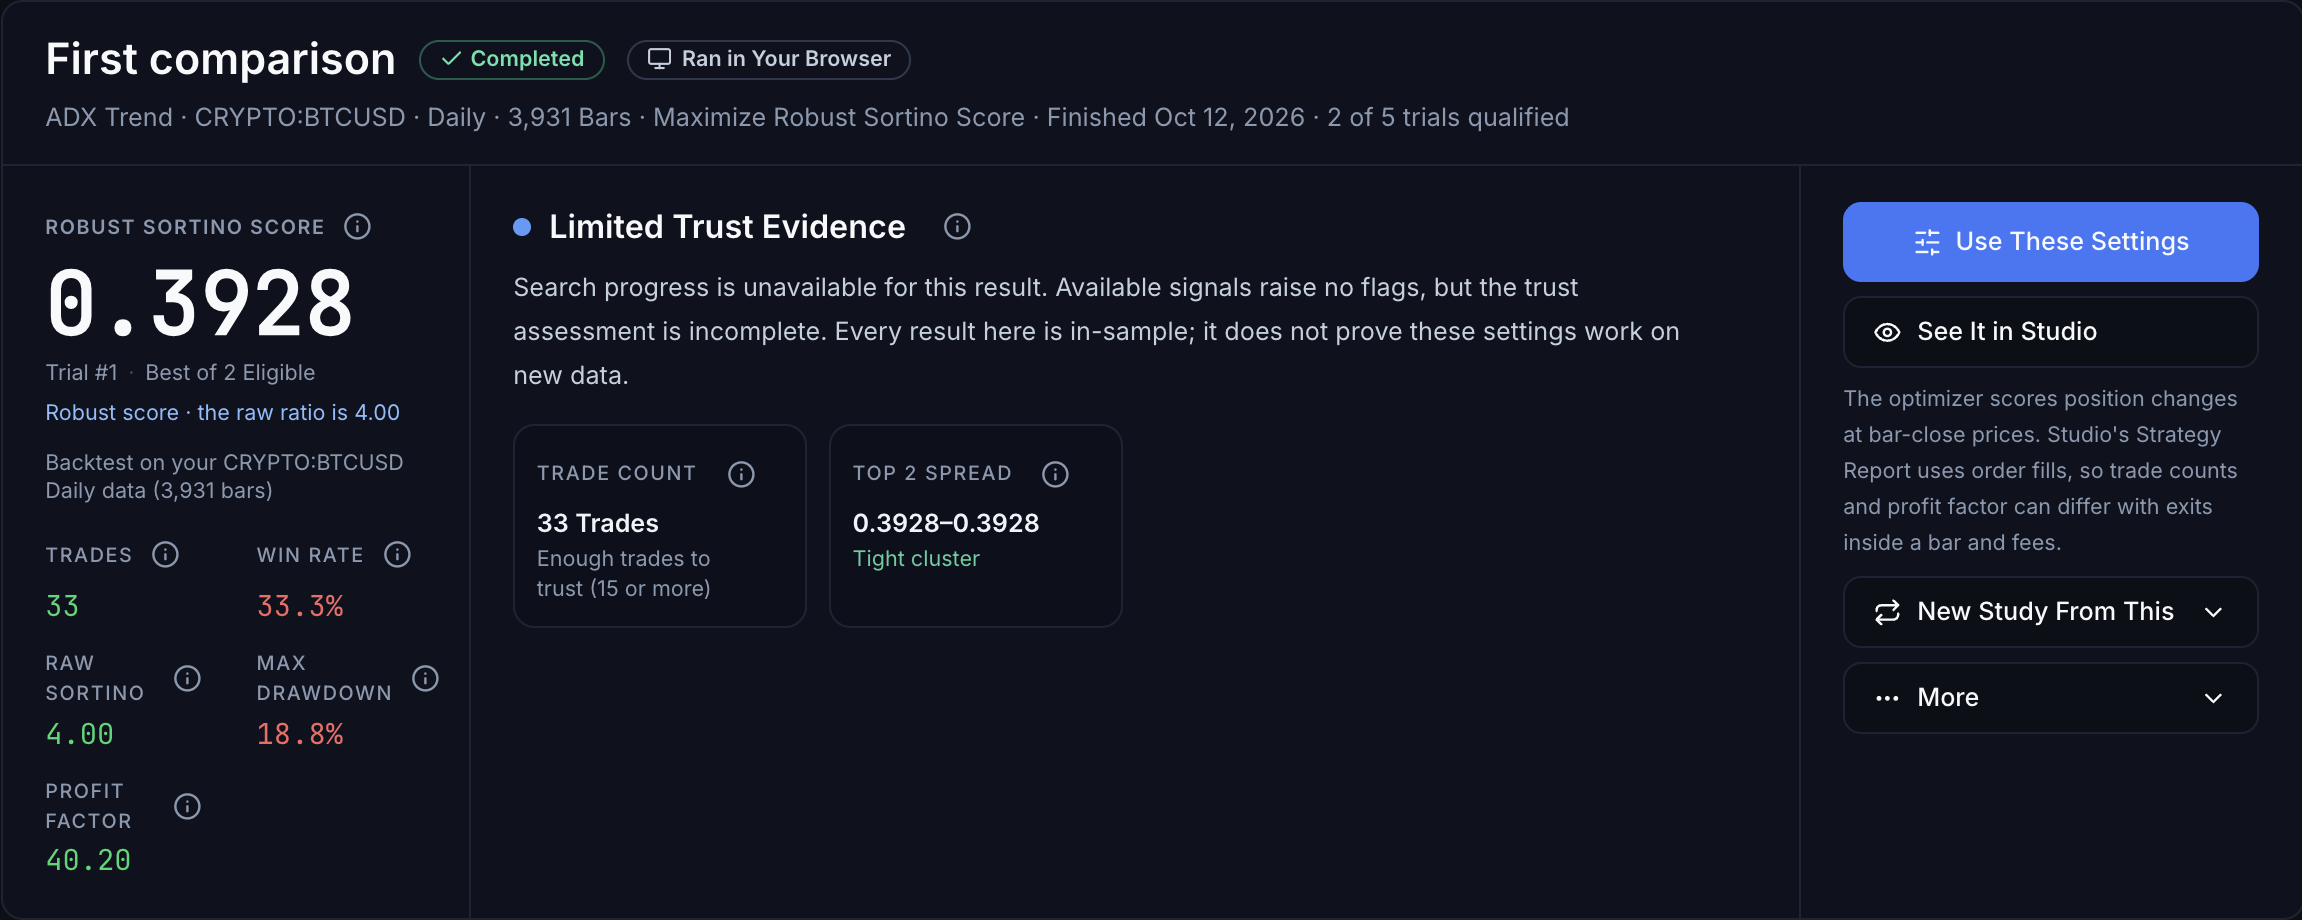
The header offers Use These Settings, See It in Studio, New Study From This and More. Use These Settings opens the best eligible trial. Select the image to open it at full size.
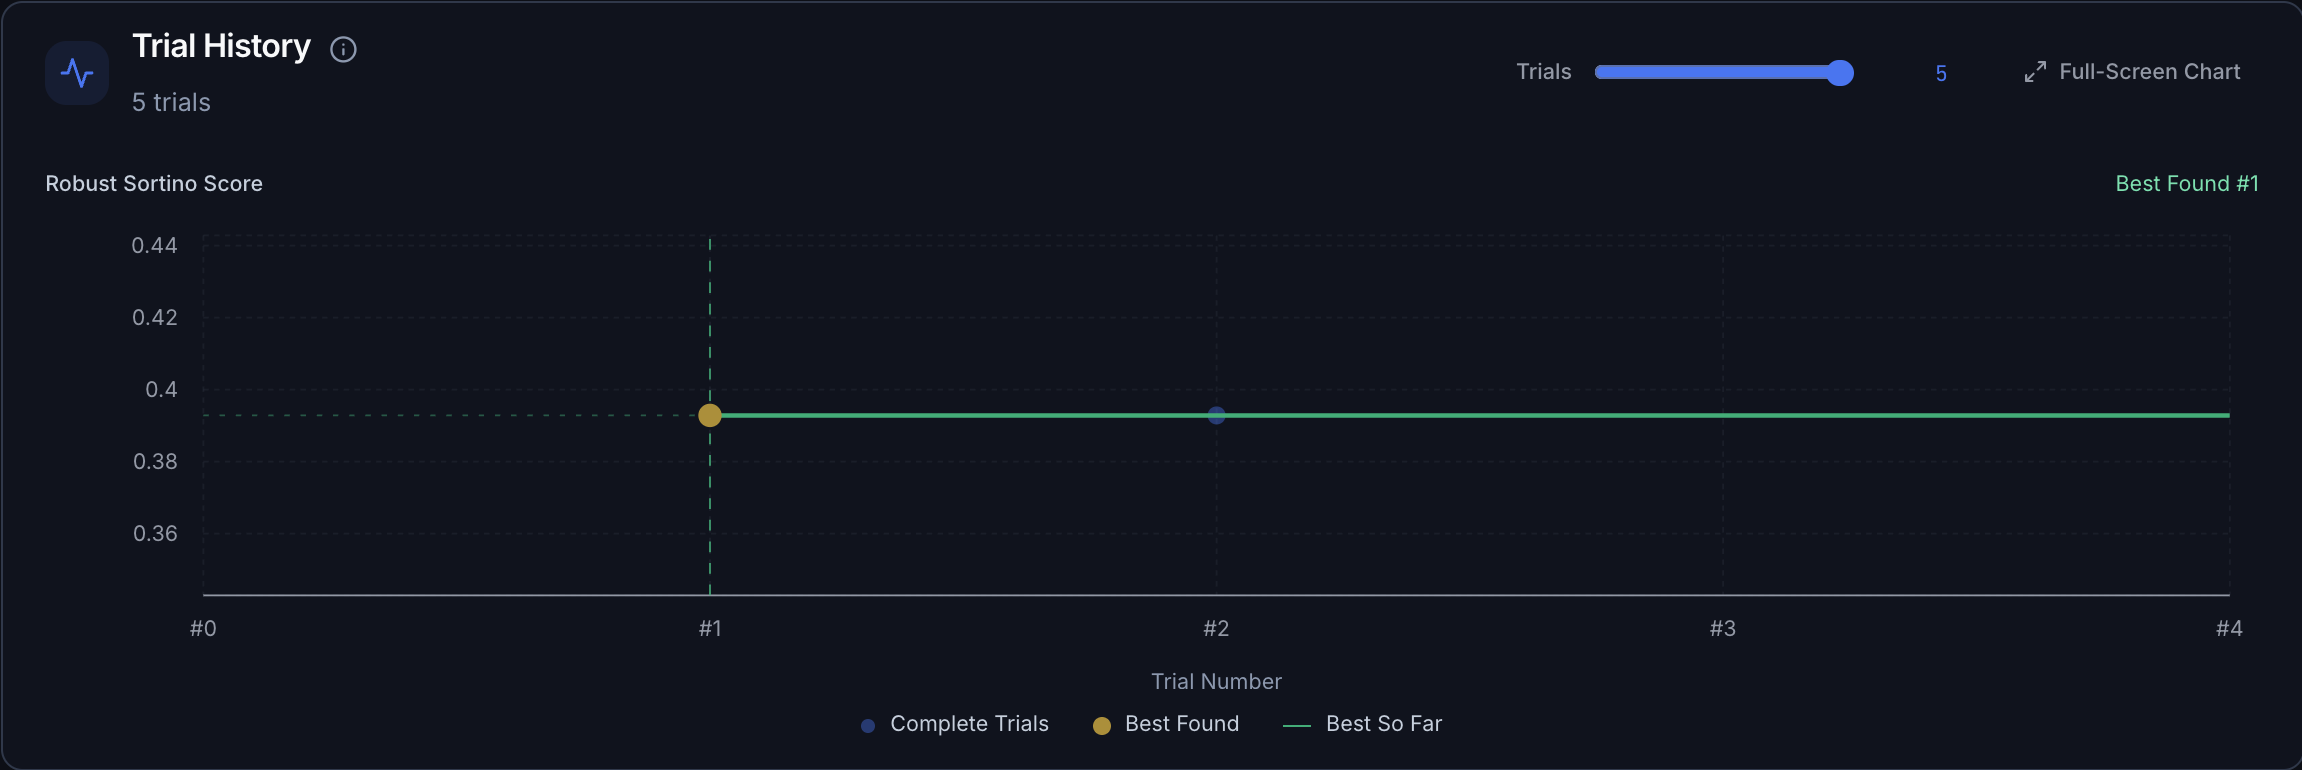
Blue dots are individual trials; the green line tracks the best so far. Only trials #1 and #2 are eligible in this example, so the other three are not plotted. Your study can sample other values and rank them differently. Select the image to open it at full size.
- In Settings, read each searched setting's Winner value, its Impact and the range Searched. Try Next appears when a suggested range is ready. To learn what the Impact percentage measures, read How Impact Is Calculated.
- In Configurations, compare the eligible trials. On a wide screen, select a column heading to sort by it, and select it again to reverse the order. On a phone, choose a field from Sort By, and use the arrow beside it to reverse the order. To use a trial other than the best one, select Use Settings in its row. Search trials or settings finds a trial by its number or by a setting's name or value. Filters narrows the list by any figure or setting. If nothing matches, select Clear Search and Filters.
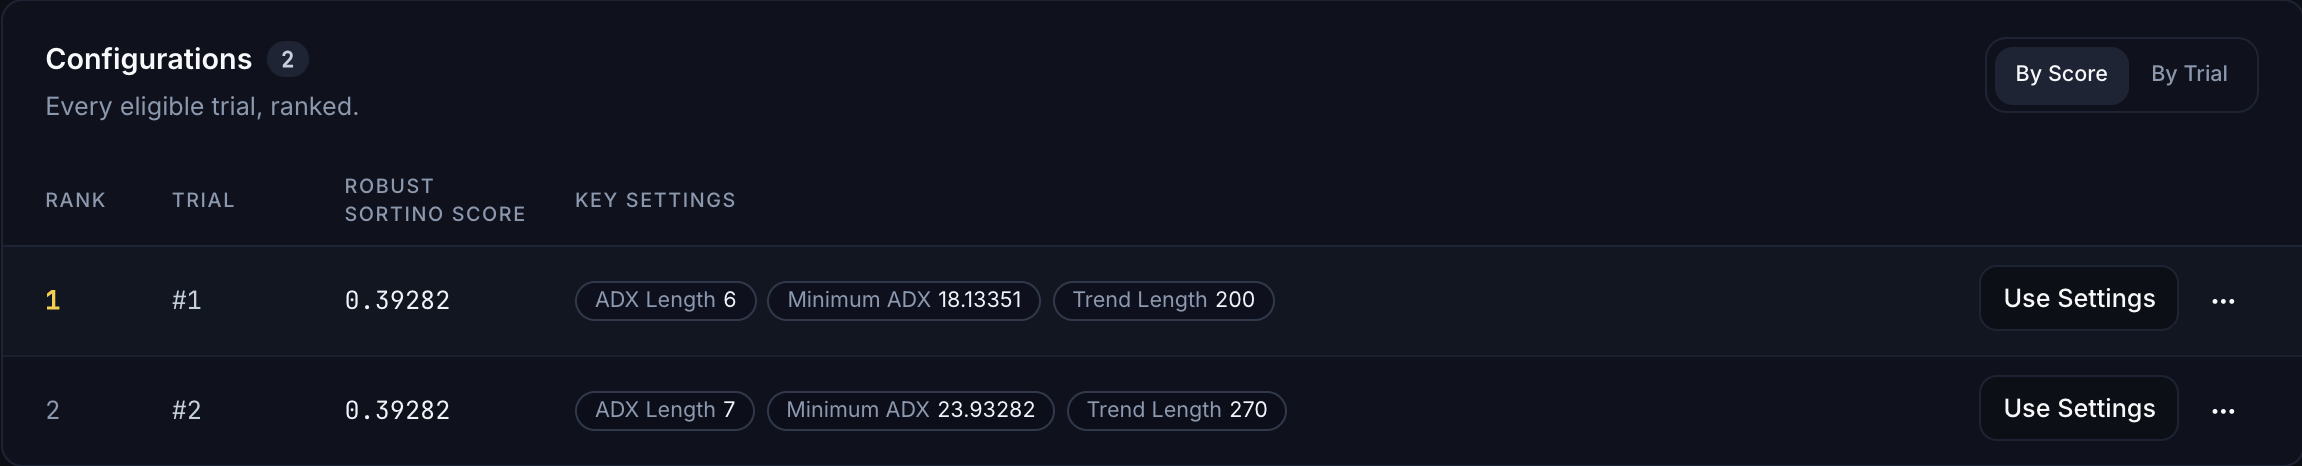
Both eligible trials show a Robust Sortino Score of 0.39282 in this example, so the displayed score does not tell rank 1 and rank 2 apart. Table values are rounded for reading; the Settings preview retains the full numeric value. Your study can sample other values and rank them differently. Select the image to open it at full size.
A score ranks tested configurations using this study's objective and eligibility requirements, such as Minimum Trades. It is measured on the same data the study searched. No score proves future performance. Different data, objectives, ranges or strategy Properties can make scores unsuitable for direct comparison. To check a candidate on data that did not guide the search, see Check Settings Without Reusing the Answer.
On a wide screen, Columns chooses which settings get their own column in Configurations, and Reset Columns restores the default. The arrow at the start of a row shows every setting of that trial. Show in Landscape, in a row's menu, marks that trial on the map. While a region is selected in Parameter Landscape, Configurations lists only the trials inside it, until you clear its In Region chip. In a study with more than one objective, the Best Trade-Off column marks the trials that no other trial beats on every chosen objective.
If the verdict shows Scored With Earlier Trade Rules, select What Changed? to read which rules were used. It does not rerun the study.
Try Next loads separately. If it says Try Next unavailable right now, select Retry in Settings if that button appears.
Expand About This Study at the bottom of the page to read the study's own configuration. Its Analysis Details section also lists the study's stored Parameter Importance. More holds Download… and, when you can delete the study, Delete Study. Download… offers Trials Spreadsheet (.csv), with every eligible trial and its settings, and Full Study File (.json), with the whole study record. Deleting a study cannot be undone. Copy Details for Support copies the study's identifiers for a support request.
What does Parameter Landscape add?
Parameter Landscape plots every eligible trial by two numeric settings and colors each trial by its score. It appears as soon as the first trial has a usable score. Before that, it says Not Enough Trials Yet, or No Scored Trials if trials finished without a usable score. The X Axis and Y Axis pickers choose the two settings. 2D Contour and 3D Topography show the same trials in two ways. The shading between trials is an interpolated estimate, not additional backtests.
The shaded surface needs at least three scored trials spread across both settings, not all on one line (two different values when the study has only one numeric setting), and their scores must not all be equal. Until then, the map shows only where the trials were tested, with a note that starts Showing trial locations only.
ADX Regime Trend searches three numeric inputs: ADX Length, Minimum ADX and Trend Length. Parameter Landscape plots any two of them at a time; the third can differ between trials that sit close together. Five trials over three dimensions is a sparse sample. Unsampled areas remain interpolated estimates, not additional backtests. Use Configurations for exact trial data.
If no numeric setting is available, the map says Needs a Numeric Parameter. If the chosen pair of settings cannot be drawn, it says Surface Unavailable; choose another numeric pair. On a wide screen, choose Both to see 2D Contour and 3D Topography together. If the 3D view cannot run in your browser, the map shows 3D unavailable; showing 2D.
To search one area more closely, see Refine a Region.
What changes when a study has more than one objective?
Use Viewing: at the top of the results to choose an objective. The headline score, the best trial and the Configurations ranking then follow that objective. The primary objective is marked (Primary). Run Again, Try Next, follow-ups and downloads still use the primary objective. Balanced Winner names one trial: no other trial beats it on every chosen objective, and it ranks best on average across all of them.
Trade-Offs plots the eligible trials on two objectives. Show as Table lists them instead, including trials the chart cannot plot because a score is N/C. On a desktop, drag on the chart to zoom, and select Reset Zoom to go back. While a study with several objectives runs, Continue With Primary Only lets the primary objective choose every remaining trial. This cannot be undone for that study. Trials already finished keep their scores for every objective. Add More Objectives explains the choice.
Return to Studio
When the study has finished, select Use These Settings in the header to work with the best trial. For another trial, select Use Settings in its row in Configurations. The Use These Settings panel asks where you want to use the values:
| Choice | What it does |
|---|---|
| Your TradingView Chart | Stage for TradingView stages the values for the indicator on your chart. In TradingView, open the indicator's settings and choose Import from Optimizer. |
| Studio | See It in Studio opens the values on this study's data so you can see the trades on the chart. Your script is not changed. |
| Clipboard | Copy Settings for TradingView or Copy as JSON copies every value. |
| Update Script Defaults | Review Script Changes shows the values before anything is written. It needs a script of your own. The card is available when Studio can retrieve the exact version's source from this browser or from an account-held copy. |
Your TradingView Chart is offered only when the TradingView transfer is enabled for the service and your script supports the transfer. It needs the AI Edge Chrome extension and the indicator on your chart. When it is not available, the card says why.
Under Review Script Changes, Apply to Studio Chart Settings saves the values as Settings and leaves the script's source unchanged. Apply to Studio Script Defaults writes the values into the input defaults in the script editor. If Studio changes your open script, its next successful compile saves a new Script Library version. If Studio opens the change in a new tab instead, save that tab with Save to Script Library. Saved Properties and other settings outside these inputs are not copied.
If a choice is unavailable, its card gives the reason. See Every Value at the bottom of the panel lists the values so you can enter them by hand.
For lists with more than 12 settings, use Filter Settings to search by a setting's name or key. When searched and fixed values are mixed, Optimized marks the values chosen by the optimizer. Use the copy button beside a value to copy that value. If the browser blocks copying, Copy This Text opens with the text selected; press Ctrl+C or Cmd+C.
The values come from three places: the trial's searched values, the study's fixed values and the Settings the study started from. An older study may not have saved all of its starting Settings. If so, the panel says what is missing. Read it before you continue.
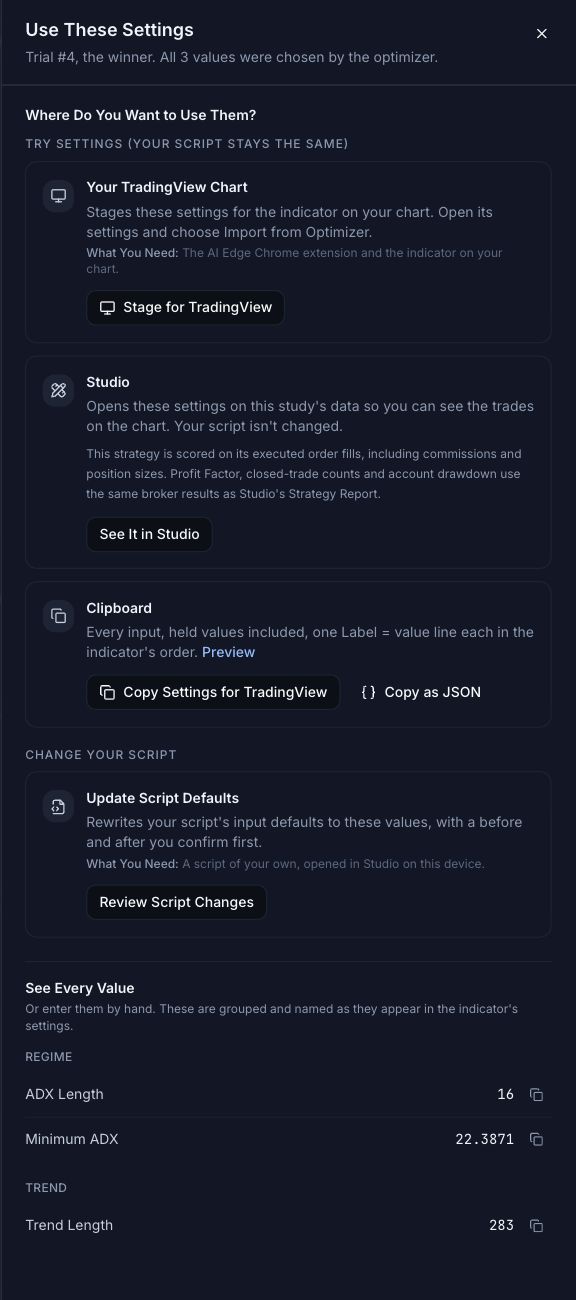
The Use These Settings panel shows where the trial’s values can go. This current UI example uses Trial 4 from a separate five-trial cloud study; your trial number and values will differ. See It in Studio applies them as Settings; Review Script Changes opens a separate preview for changing input defaults in the source. See Every Value lists the chosen values below. Select the image to open it at full size.
Studio saves a named trial configuration and runs the compatible original script. Open Settings to check the active name and values. The three numeric inputs become the trial's sampled values. The source still declares the original defaults and remains Version 1.
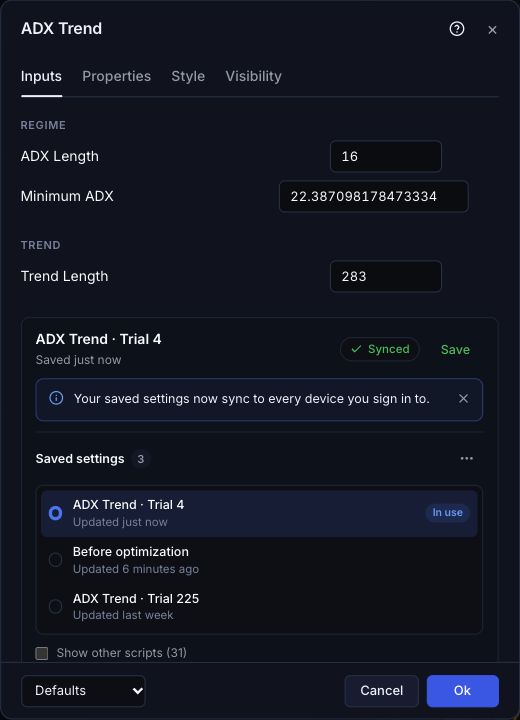
The result is a new Settings configuration for the same source. Studio names it after the script and trial: ADX Trend · Trial 4 in this example. The saved configuration shows Synced on this signed-in paid account. Select the image to open it at full size.
If Studio cannot open the trial's Settings, find your case:
- Studio cannot retrieve the exact source. Use the browser that holds the source, reopen an available account-held copy, or restore the exact source and attached libraries from your backup. Then save the script for optimization and return to the results. The saved build must match the build this study ran.
- The saved script differs from the build this study ran. The study keeps the version it tested. Restore that build first.
- The script's inputs changed after the study. Open the version that the study ran, or map the values to the new inputs yourself.
- An open tab has unsaved Settings or changed source. Studio keeps that tab as it is and can open a second tab with the same source and the trial's Settings.
Settings compatibility and recovery explains the options.
To continue, save another configuration, or start another study as described in Run the Next Study. Export an Edited Source Copy (Optional) is a separate step. Do not use it to force Settings onto a script they do not fit.
When the opened script is a strategy, select Strategy → Metrics to inspect its performance over time, returns, drawdowns, and capital use. Select Trades to investigate an entry and exit on the chart. The strategy report guides explain those views and the simulation assumptions behind them.
A study of a strategy() script that you start now is scored on its Executed Trades, so its profit factor and closed-trade count match Studio's Strategy Report. A study scored on Signal Returns builds trades from position-signal changes priced at bar closes, without order fills or position sizing. By default its signal cost is zero, so fees and slippage are left out; a configured Signal Round-Trip Cost is subtracted before scoring. Its trade count and profit factor can therefore differ from the Strategy Report's. The report's monthly Sharpe and Sortino ratios also differ from the study's per-trade ranking ratios, and Total P&L includes open profit or loss. See What the Study Scores.
Run the Next Study
A finished study can set up the next one for you. Select New Study From This in the header of the results page:
- Run Again uses the same data and settings. If the best trial sat on the edge of a range, that range is widened, and the menu lists each change. If the study's data is no longer kept, Results says This Study Cannot Be Run Again. Start a new study and upload the data again.
- Run This Follow-Up searches the Try Next ranges from Settings. The item can read Run Again With These Ranges when more trials on those ranges are the better next step. If no follow-up is available, the menu gives the reason.
- Refine a Region… selects a suggested region on Parameter Landscape when it can. Check the ranges and the trial count, or change them. It does not start the new study. See Refine a Region.
With these three choices, nothing launches until you review the new study and start it.
The menu can also offer Run This Study In The Cloud. It appears for a finished browser study of your own uploaded strategy, while its data is still kept and the strategy build still matches. When you select it, a dialog checks your credits and shows how many the study uses. Nothing starts until you select Start Optimization, or Queue Study if the study has to wait. Cancel closes the dialog. After you confirm, the app checks that the strategy can run in the cloud. If a check fails, read the reason shown. The new cloud study uses the same data and ranges. Cloud studies use optimizer credits; studies in your browser stay free.
You can also choose Optimize again in Studio to build a new study from the script.
Refine a Region
Refine a Region sets up a new study that searches only part of this study's search space. It needs at least two numeric settings that were searched as ranges. Nothing starts until you start it.
- On the finished study's Results page, select New Study From This, then Refine a Region…. On a phone, open More first.
- Parameter Landscape opens on 2D Contour. When it can, the app selects a suggested region around the better-scoring trials. Check the ranges and the trial count shown with it. If no region can be suggested, Edit Bounds opens. On a phone, region selection turns on instead.
- To see the trials in the region, select the trial count, for example 16 Trials. Configurations then shows only those trials. On a phone, this opens the Trials tab.
- To change the region, drag a new box on the map, or select Edit Bounds and type the bounds. On a phone, tap Refine a Region on the map before you drag. A bound that falls between valid steps moves inward to the nearest value the study can test.
- Select Create Follow-Up. New Study opens with the region's ranges.
- Check the data, the settings and each range. Then select Start in This Browser or Start Optimization.
To clear the selection, select Deselect. The map refuses a box in two cases:
- That covers the whole search space. Drag a smaller region.
- Drag a larger region: it needs at least two valid values on each axis.
If Could Not Prepare the Follow-Up Study appears, read the reason. Fix it, or wait for a temporary problem to clear, then select Create Follow-Up again. Your region stays selected.
If This Study Cannot Be Refined appears, the study's stored data is no longer kept. Start a new study and upload the data again.
When the best results sit against the edge of what the study searched and were still improving toward it, the 2D map marks that bound with a dotted Pressed Bound line. If your region reaches that edge, a note under the map names the setting and the bound the best results press against. Select Extend to … in the note to move the region past that bound, as far as the setting allows. Edit Bounds can also reach past the searched range. The map draws that part dashed, because it has no trials yet. A best region that is cut off at a bound is worth testing, not a finding. If your script's own limit stops the region, the note offers Change the Limit… instead.
When a Script Limit Stops a Region
A script can set the lowest and highest value an input accepts, with minval and maxval. If the region you want reaches past one of these limits, Results can offer Change the Limit….
- Select Change the Limit…. A preview titled Change Your Script's Limit? or Change Your Script's Limits? opens. It shows each source line before and after the change. Cancel closes it and changes nothing.
- Select Change Script in Studio. Studio changes only those limits in your script. If Studio cannot match the script exactly, it opens a copy whose name ends in - Wider Limits and leaves your scripts as they were.
- In Studio, select Optimize without making other edits. If Studio says the editor or the attached libraries differ from the saved version, save a new version, then select Optimize again.
- New Study opens with your region. Check the data, the settings and each range. Then select Start in This Browser or Start Optimization. The original study keeps its script version and results.
If the dialog is titled This Limit Has to Be Changed by Hand or These Limits Have to Be Changed by Hand, Studio cannot make the edit for you. Select Close. In the script, change each named minval or maxval to the value the dialog shows, then select Optimize. The region is not carried over, so type the ranges again in New Study.
| Message | What to Do |
|---|---|
| This device does not hold the script's source, so it cannot be changed from here. | Open the exact script in Studio on this device first. Do not use a script that only has the same name. |
| Studio is still holding an earlier change from a results page. Open Studio to finish that one first. | Finish the earlier change in Studio. Then come back, select the region again and select Change the Limit…. |
| A message that ends Nothing was changed. | Select Change Script in Studio again. If the message mentions session storage, allow site data for this site first. If it keeps happening, contact support. |
| Your script's new version is built, but the follow-up on it could not be prepared. | Select Try Again. |
| This Region Cannot Be Searched | Check the ranges in Edit Bounds. A new script limit cannot fix a range that is too narrow for its steps, or a limit set by the data, such as Max Bars Back. |