Backtest a Pine Script Strategy in Your Browser
AI Edge Studio lets you edit supported Pine Script® and run it against price bars in your browser. A strategy's orders produce a Strategy Report with simulated trades and equity. This guide gives you a small, reproducible example before you try a real market dataset or an optimization study.
This is an accounting exercise, not a trading strategy. Its invented prices and deliberately timed orders explain order timing and commissions. The example loses four currency units after costs. It is not evidence of profitability or of matching another platform.
For the broader workflow with a curated strategy and recorded Bitcoin data, use Your First Study. To decide which tool fits your task, start with the Studio and Optimizer overview.
Download the Complete Example
Published October 21, 2026. These files are original synthetic teaching material, not an exchange feed or a historical market backtest.
- Pine Script source: two-trades.pine
- Price data: twelve-bars.csv
- Expected results, assumptions and SHA-256 hashes
The dataset contains exactly 12 daily bars, from January 1 through January 12, 2025, at 00:00 UTC. Its time column uses Unix seconds. There are no missing days, imported libraries, adjustable inputs, random trials or network data dependencies in the calculation.
Load the Data and Script
- Sign in and open Studio. Read free access and compatibility limits if this is your first visit.
- Select the data button at the chart's bottom left. In Data Source, choose Imported Data, enter an optional name such as Twelve synthetic bars, and set Quantity to Whole Units (Stocks, Forex, Futures). Then choose the downloaded CSV file and select Load. Confirm 12 bars and a daily interval. See CSV format and import recovery if the file does not load.
- Open a blank editor tab and paste the downloaded Pine source. Do not add bars or change the source while checking the expected results. Studio compiles and reruns after edits. Wait for Compiled, then open Run Overview from that status control if you need to choose Run Again.
- Open Settings, then Properties. Keep the source defaults: initial capital 10,000, fixed quantity 1, pyramiding 0, commission 1 per order, slippage 0, and order execution delay One tick · next eligible bar. Reset old Settings if they override the source. Read broker emulator assumptions before changing them.
- Select the Strategy tab. Inspect the two closed trades in List of trades, then compare the totals below. This exercise does not start an Optimizer study or use cloud-study credits.
Save the script and keep the downloaded files as a backup. Browser storage belongs to this device; storage and recovery explains what is stored or sent when you use other Studio actions.
Why These Two Trades Occur
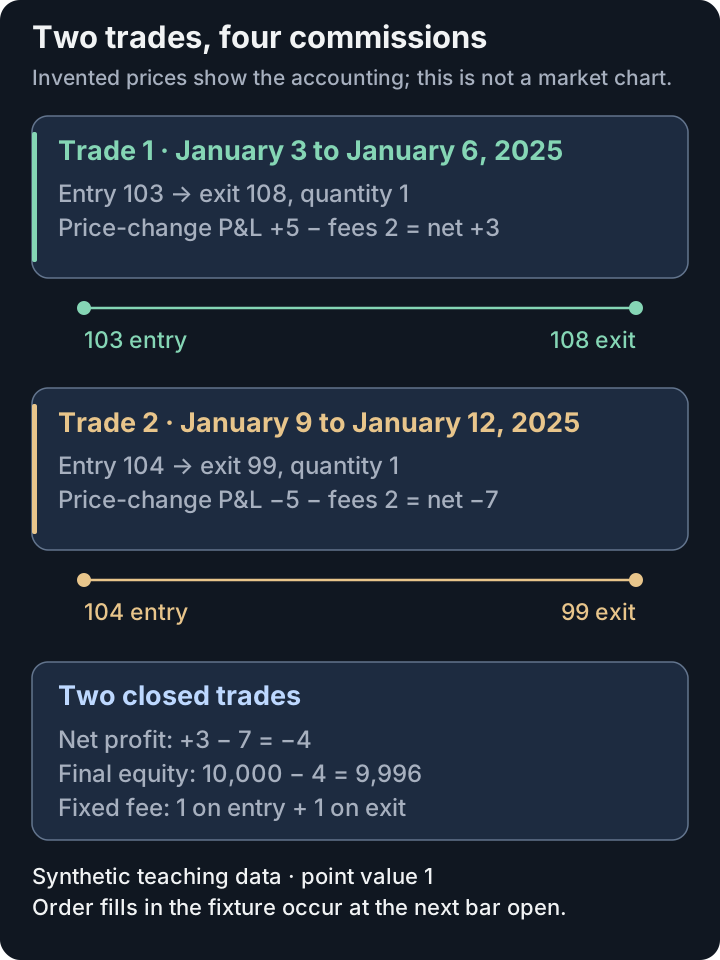
These are the exact invented trades in the downloadable fixture. The schematic shows fills and fees, not an exchange price chart.
Pine counts the first bar as bar_index == 0. The source submits entries at indices 1 and 7 (January 2 and 8), and exits at 4 and 10 (January 5 and 11). With process_orders_on_close=false, these market orders fill at the next bar's open in this fixture. The last bar is included so that the second exit can fill.
| Trade | Entry fill (UTC) | Entry price | Exit fill (UTC) | Exit price | Quantity | Before fees | Entry + exit fees | Net P&L |
|---|---|---|---|---|---|---|---|---|
| 1 | Jan 3, 2025 | 103 | Jan 6, 2025 | 108 | 1 | +5 | 2 | +3 |
| 2 | Jan 9, 2025 | 104 | Jan 12, 2025 | 99 | 1 | −5 | 2 | −7 |
Prices and P&L here use a unit point value of 1, minimum whole-unit quantity of 1, and price tick of 1. Each trade pays one unit on entry and one on exit. Both positions close, so there is no remaining open profit.
- Closed trades: 2; one winner and one loser.
- Price-change P&L before commissions:
(+5) + (−5) = 0. - Total commissions:
4 orders × 1 = 4. - Net profit:
0 − 4 = −4. - Final equity:
10,000 − 4 = 9,996.
Studio's report uses its own metric definitions. For example, its Gross profit and Gross loss already include each trade's commissions, so for this fixture they are 3 and 7, not 5 and 5. Do not subtract fees a second time. Start with actual fill prices, quantity and net P&L rather than comparing similarly named summary fields in isolation.
What We Verified
The published source and data were compiled and executed with the PineWASM compiler runtime bundled with this website, reporting compiler version 0.1.0, intermediate-language version 2, and Pine language version 6. The run produced no compiler diagnostics or runtime errors, the two fills above, net profit −4, and final equity 9,996. The expected-results file records the exact source, dataset and runtime-binary SHA-256 hashes. An automated repository check reruns this fixture and compares those results.
That verifies this finite example with that bundled runtime. It does not attest to the current deployed Studio engine version, every Pine feature, identical TradingView fills, or real brokerage execution. A version label alone is not a precise runtime identity; use the binary hash for this fixture. When checking the deployed app, record the PineWASM version from Run Overview, the symbol's quantity and point-value assumptions, and any overridden Properties with your result. If it differs, keep the source and CSV unchanged and inspect the first differing trade.
The source intentionally has no adjustable inputs: it is an order-accounting check, not an optimization candidate. For a compatible five-trial browser study, use the ADX example. Backtest versus optimize explains when a study's score can differ from a Strategy Report.
Move From an Exercise to a Market Test
Use your own supported script and a recorded dataset whose source, symbol, timezone, interval and coverage you can identify. Keep the exact CSV, source version, attached libraries and input values. Record your costs and fill assumptions before reading the profit figure; then inspect individual trades and test a separate period that did not guide your settings.
Twelve invented bars cannot establish robustness, execution quality or future returns. For a careful cross-platform check, follow Compare AI Edge Studio with TradingView. For larger studies, read objectives and scores and the Strategy Report guides.