Manage Studies, Profiles and Data
Use this page once you have run a few studies. Find a Study covers search, filters and Group By. This page covers sorting, comparing in detail, study profiles, market data files, saved datasets and runs that stopped early.
Three kinds of saved setup are easy to mix up:
- A Settings configuration saves one script's Inputs and Properties. See Save and Reopen Settings.
- A study profile saves a New Study setup, so you can start a similar study later.
- A saved dataset keeps market history in your AI Edge account.
Saving one of them does not save the others, and none of them saves your script's source. Source versions and optional cloud sync are managed separately in My Scripts.
Sort the Studies List
On Studies, open the sort menu, shown as Sort: on a wide screen. Under Sort By, choose Last Updated, Best Value, Win Rate, Raw Ratio, Max Drawdown, Profit Factor, Trades or Date Created. Choose Descending or Ascending in the same menu, or select the arrow button beside it. When you choose a field, Max Drawdown starts with the smallest drawdown (Ascending), and the others start with the highest value or the newest date (Descending).
Raw Ratio is the raw value of each study's own objective. When studies use different objectives, their raw ratios measure different things, so do not rank them against each other.
Group By puts the same studies into groups. Find a Study lists its choices. Sorting and grouping change only the view, not the studies.
In Filters, Freshness is the study's age: Fresh (up to 14 days old), Aging (up to 30 days old) or Stale (older than 30 days). Age counts from when the study finished, or from when it was created if it has not finished. It does not tell you how recent the market data is.
Compare Studies in Detail
Compare Studies explains how to open Compare for 2 to 4 finished studies. On the comparison page:
- Each study has a card with its Trials, Strategy, Scoring basis, Market, Data Range and Age. Check these before you read the numbers. Scoring basis reads Executed Trades (Fees Included) or Signal Returns; see Check What the Study Scores. Open Results opens that study's results.
- Metrics ranks Best Value, Win Rate, Max Drawdown, Profit Factor and Total Trades. In each row, the best value is green and the worst is red. For Max Drawdown a lower value is better. For the other rows a higher value is better.
- Metrics are ranked only when every study has the same scoring basis. If the scoring bases differ, no row is ranked, and each row says Different accounting: not ranked.
- Best Value is ranked only when every study also uses the same objective and scoring settings. Otherwise its row says Different objectives: not ranked.
- Overall Winner marks the study with the most green values. It appears only when all the studies have the same market (symbol and timeframe), the same objective and the same scoring basis, and one study has more green values than any other. Otherwise the page says why, such as No overall winner is named: these studies differ in market.
An overall winner leads only on these backtests, which are hypothetical results on past data. It does not show that its settings will do as well on new data.
Save and Reuse a Study Profile
A study profile includes the setup's search ranges, fixed values, features and run preferences, such as the trial count and objectives. You choose the market data and the study name again each time. You need to be signed in to save one.
- Set up the study in New Study.
- Select Save Profile at the top of the page. Enter a Profile Name of up to 60 characters and, if you like, a Description. Then select Save Profile in the dialog. The profile is saved in this browser.
- To use it later, open Profiles at the top of New Study and select Use Profile on its card. Then choose the market data and check the whole setup before you start.
When you change a setup that came from a profile, a dot beside its name marks Unsaved changes. Save Changes updates the profile. The + button beside it (Save as New) saves the changed setup as a separate profile. Each card has icon controls with the tooltips Edit profile, Duplicate profile and Delete profile. Deleting opens a confirmation: Delete Profile confirms, and Keep Profile cancels.
With a paid plan, a card marked This Browser also offers Sync to Account. It makes a copy marked Account · Across Devices that you can use on any device. The browser copy stays as it is. Browser profiles stay on this device and are kept when you select Start Fresh.
Check an Imported File
Studio's chart import, New Study's file reader and Dataset Library are different import paths. A file accepted by one path is not proof that another accepts it.
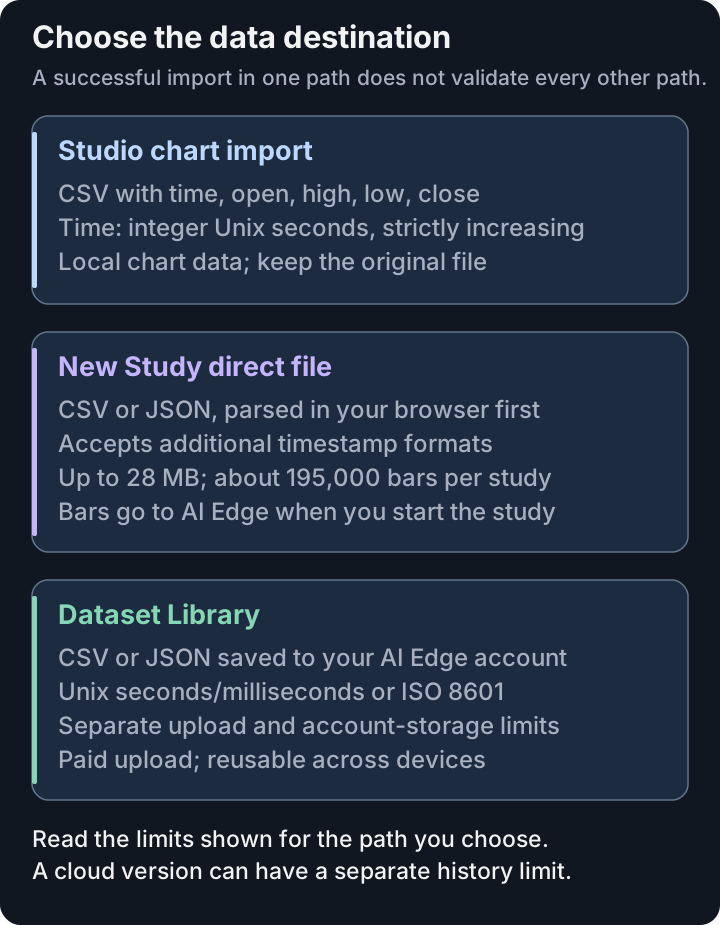
Choose the destination before preparing the file. New Study's roughly 195,000-bar study allowance does not increase Dataset Library's configured upload limit or the number of bars that a strategy version's cloud check allows.
In New Study, under Add Market Data, select Upload a File, or drop the file anywhere on the page. How to Get Data In, on the same panel, lists what New Study reads:
- a CSV or JSON file up to 28 MB, with at most about 195,000 bars per study;
- a time column named
timeortimestamp, in Unix seconds or milliseconds, or as ISO 8601 dates; open,high,lowandclosecolumns, with volume optional;- in JSON, an array of bar objects with
timestamp,open,high,low,closeandvolume, or Databento JSON lines.
A CSV file from TradingView's Export Chart Data… works as it is. New Study reads and checks the file in this browser first. Its bars go to AI Edge when you start a study.
Then follow what New Study shows:
- If the dates could be read two ways, such as 05-03-2025, it asks Which date order does “[file name]” use? Choose DD-MM-YYYY or MM-DD-YYYY. Each choice shows how an example date from your file would read.
- If the file has more bars than one study can use, it shows Too Large for One Study. Select Use the Latest 195,000 Bars to keep the most recent bars, or Choose Different Data. Undo Trim puts the full file back.
- Check Bars, Range and Timeframe below the chart, and check the symbol. Enter the symbol yourself if New Study could not read it from the file name. Find matching market listings suggests listings. It sends the file name, the symbol you typed and the bar times, but no prices or volume.
- Read each warning. If some rows were skipped, select Show Skipped Rows to see which rows and why. If the file is short, the warning says how many bars it has and how many a study should have. Keep This Data keeps the file as it is. It does not add bars.
A study on too few bars often ends with no ranked result, because most trials cannot reach the minimum trade count. The warning's threshold is set in Studio Settings.
Studio's chart reads CSV files with stricter rules. See If a Data Source Does Not Load.
Reuse a Saved Dataset
Datasets in the sidebar opens Dataset Library. It holds market data saved to your AI Edge account, ready to reuse in studies and with an AI assistant.
- Type a name or symbol in Search by name or symbol…, then select Search. Clear Search shows every dataset again.
- Check the card: its symbol, timeframe, number of bars, file size and UTC date range. A similar name does not mean the same bars.
- Select Use in a Study. New Study opens with that dataset selected. Check the rest of the setup before you start.
Saving datasets to your account is part of a paid plan. On a free plan, the page says Paid plans save datasets to your account, available on any device. On a paid plan, select Upload Dataset, choose the Dataset File (CSV or JSON), and enter a Name and the Symbol as EXCHANGE:TICKER, such as COINBASE:BTCUSD. Then select Upload and Save. AI Edge reads the timeframe from the bars.
Saved datasets accept integer Unix seconds or milliseconds, or ISO 8601 timestamps; ISO values without a timezone are read as UTC. They have their own upload, bar-count and account-storage limits. Read the limits shown on the upload page; the saved-dataset rules describe the default policy. A file that New Study can read directly can still exceed Dataset Library's limits.
The card's actions menu has Copy Dataset ID and Delete. Deleting cannot be undone. A dataset that a study still uses cannot be deleted. This includes a study you deleted from your list, because AI Edge still keeps that study. Keep the original file if you may need it again.
Reopen Data Inside New Study
In New Study, select Reopen a Saved Dataset. The list has two groups: On This Device and In Your AI Edge Account. Type in Search your datasets to find one, then select it to load it. The account group shows at most 200 datasets. If you cannot find one there, search for it in Dataset Library.
If New Study shows Saved Dataset Not Available, the dataset was deleted or is not shared with you, so select Choose Different Data. If it shows Couldn’t Load with the dataset's name, select Try Again.
Recover an Interrupted Run
New Study saves your setup in this browser as you go, so a reload or a later visit picks it up. It clears that copy when the study starts, when you select Start Fresh and when you sign out. When you come back, Picked Up Where You Left Off says what returned. Nothing has started means that no study was launched.
If the note says this browser didn’t keep the data file, select Upload a File and add the same file again. Then check Bars, Range and Timeframe before you start.
When New Study opens with a fresh setup, it can show Your last setup is set aside. Resume it to pick up where you left off. To get that setup back, select Resume before you change anything on the page. Your first change replaces the set-aside setup. The notice does not mean a study is running. After you resume, check the name, strategy, market data and settings before you start. The notice's ✕ button closes it.
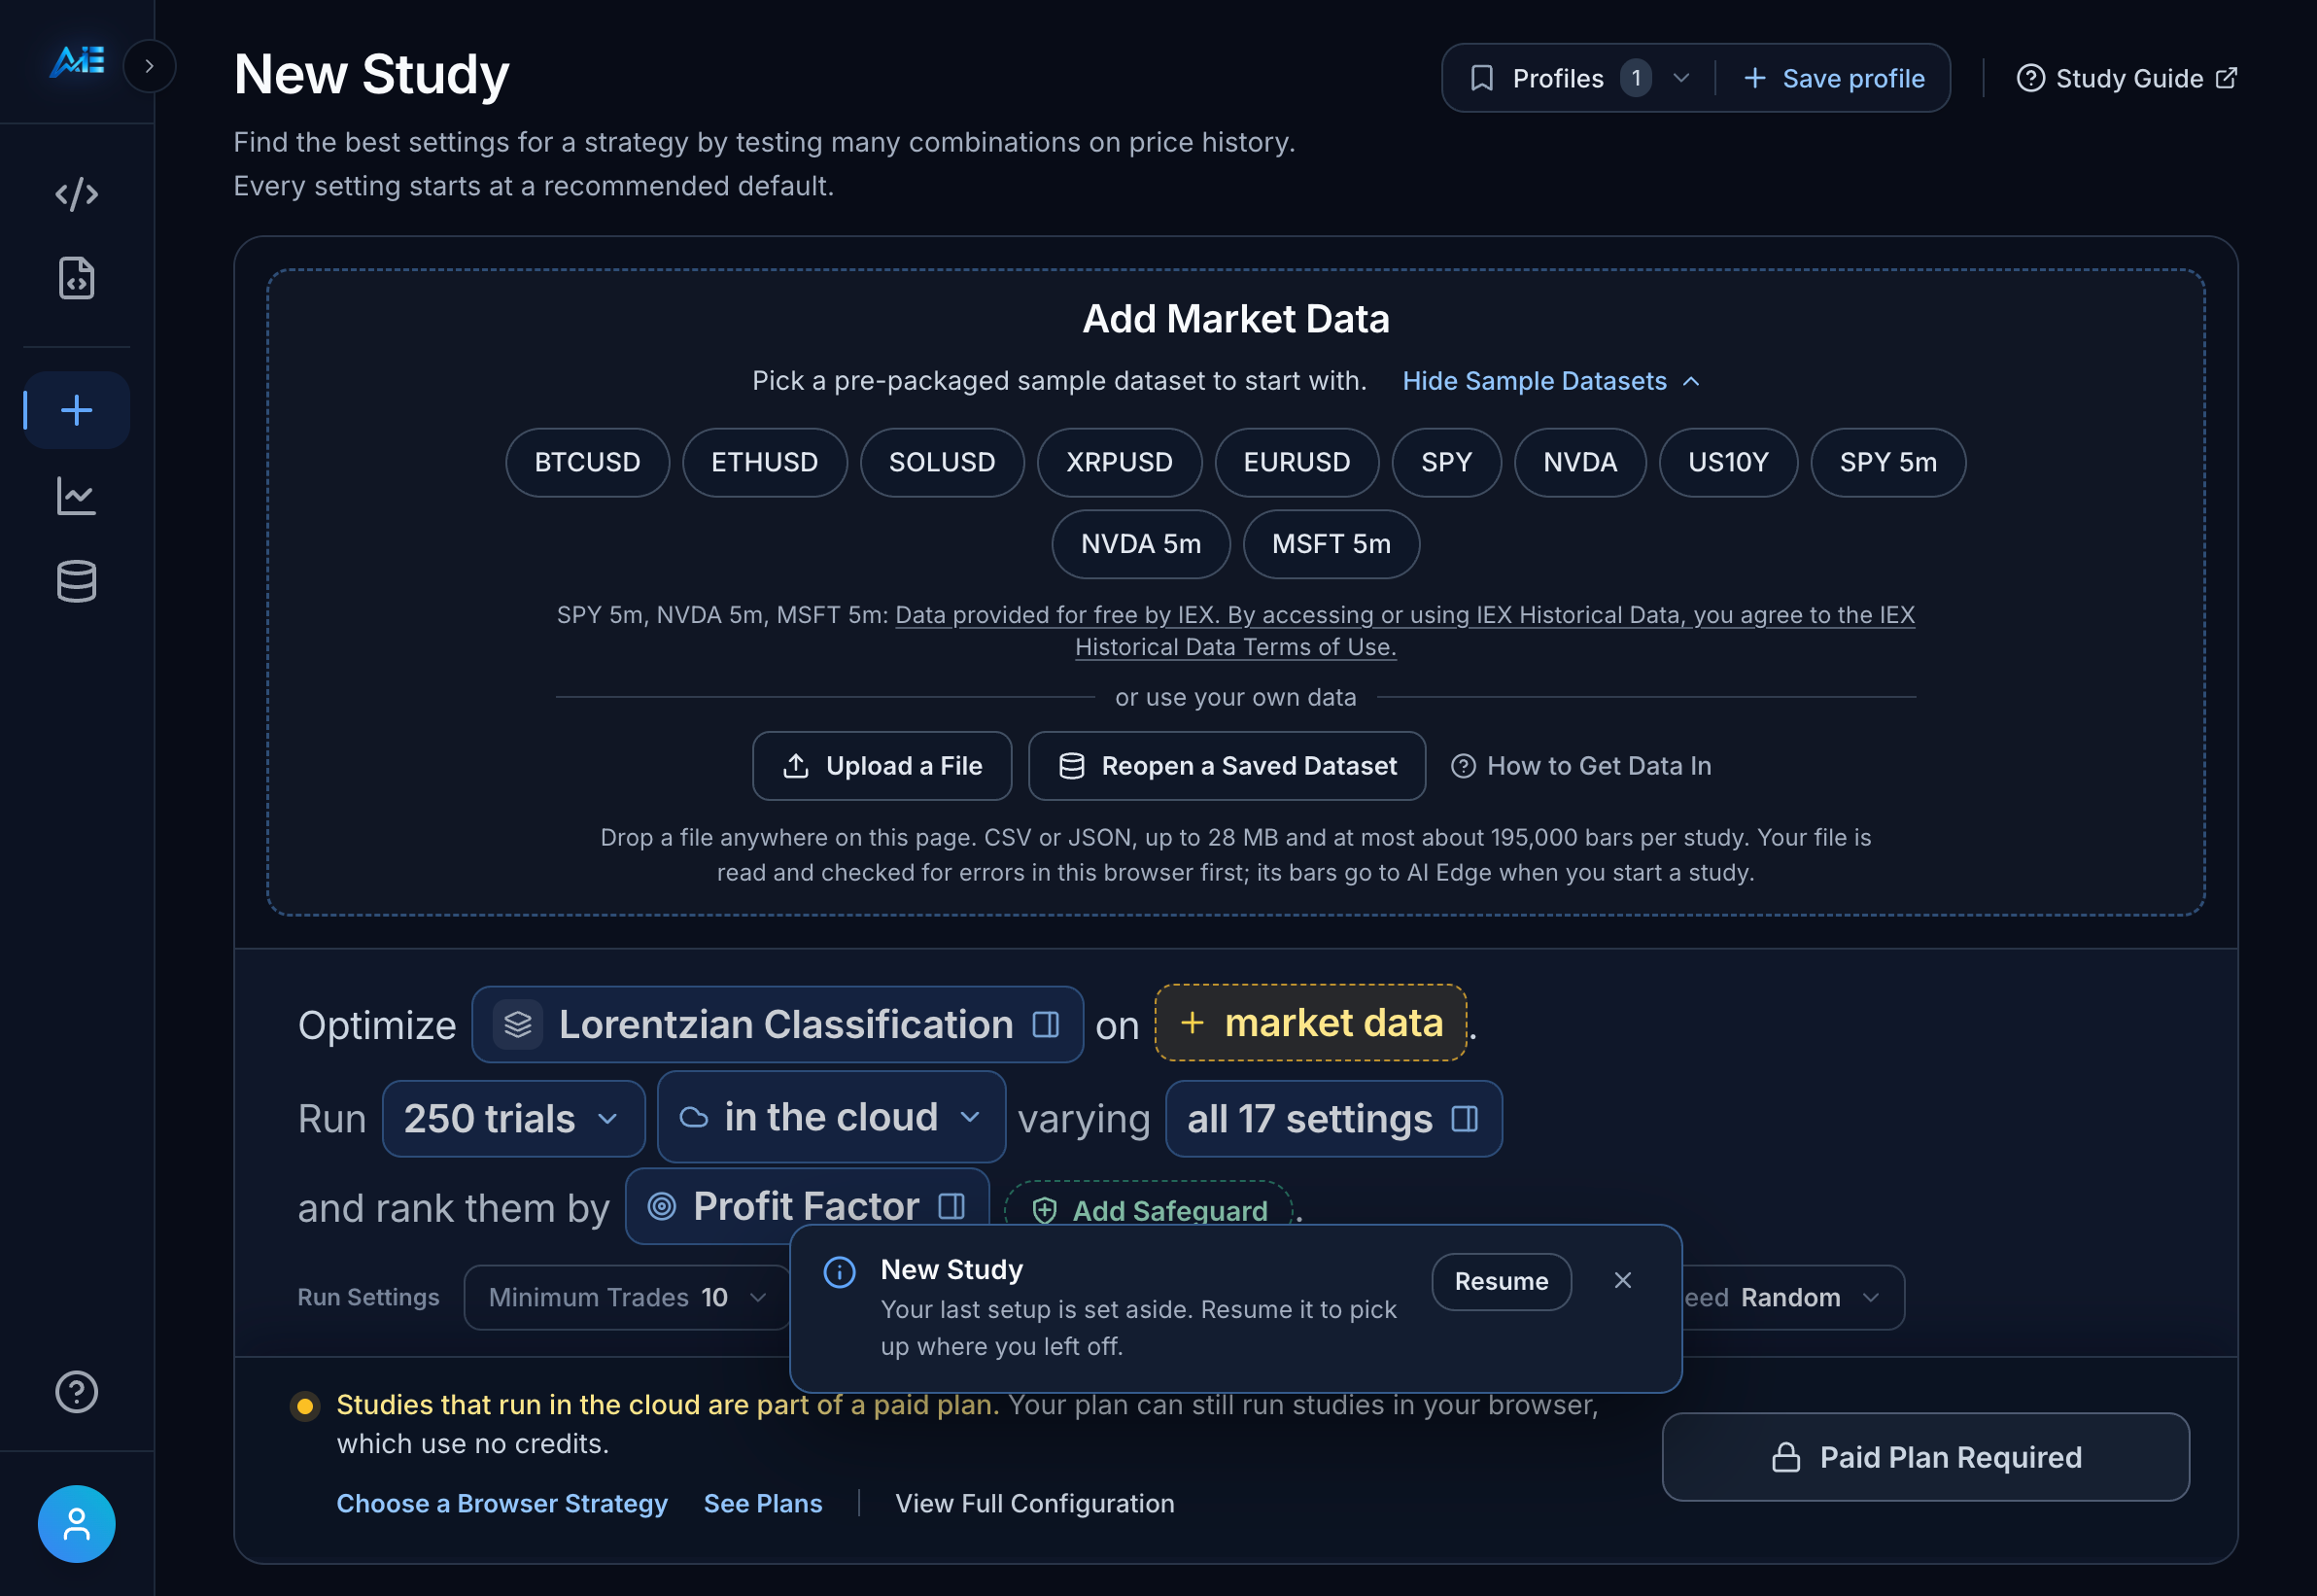
New Study shows the set-aside notice with Resume. Select Resume before you change anything on the page. Select the image to open it at full size.
If New Study says We couldn’t confirm the study started., the study may have started anyway. Select Check Studies and look for it before you try again. Your setup is kept. Try Again Anyway can start a second copy of the same study.
Browser Run Recovery
A study that runs in your browser needs its tab. You can move around the app while it runs, but closing or reloading the tab stops it. Before you close the tab, select Stop Running to park the study cleanly. If the tab closes unexpectedly, its claim on the study expires after about three minutes. The server then frees the slot and retains the trial state already recorded. An in-progress calculation that did not finish may need to run again.
| State | What it means | What to do |
|---|---|---|
| Running Elsewhere | Another tab or device is running the study. | Go back to that tab. To move the run here, select Take Over In This Tab. |
| Paused For Takeover | The run was paused on the server. Its trials are kept. | Select Take Over In This Tab to continue here. If the other tab does not let go in time, close that tab and try again. |
| Waiting To Upload | The run is paused until this browser can send the results it holds. | Keep the tab open and check your connection. These unuploaded results depend on the copy on this device; do not clear site data. |
| Waiting For Checks | The run is paused while AI Edge checks earlier results. | Wait. The run continues on its own. |
| Browser Storage Full | This browser has no room left to save the study's progress. | If Export Local Results appears, select it first. Then select Free Up Space. See Studies That Run in This Browser before you remove a copy. |
For a missing script, lost Settings or an error message, see When Something Goes Wrong.