Backtesting vs. Optimization: What Each Result Measures
Backtesting evaluates one configuration on historical data. Optimization searches across configurations and ranks their backtests. In AI Edge, a study is scored either on a strategy's Executed Trades, the same order simulation as Studio's Strategy Report, or on Signal Returns, a separate signal-based measurement. A higher Signal Returns score does not establish that a strategy would have earned more after costs.
Use this guide when choosing a Pine Script® research workflow or interpreting a trial. For the controls, start with your first study.
Which Result Answers Your Question?
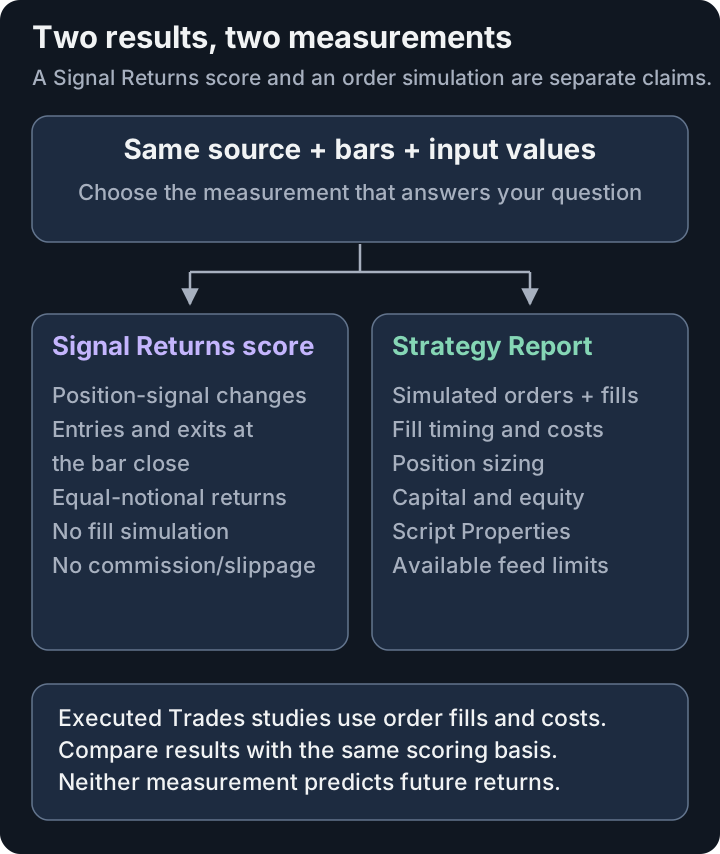
The diagram shows a Signal Returns study at its default zero signal cost. Compare a study score with another score using the same scoring rules and basis. Compare a Strategy Report with another order-based report using aligned data and simulation assumptions.
| Your question | Where to look | What the result measures |
|---|---|---|
| Which tested input values scored better on this dataset? | Optimizer study results | Executed trades or signal returns, as the study's basis says, ranked by the selected objective. |
| What orders and fills did this strategy simulate? | Studio's Strategy Report | Strategy orders, fills, costs, position sizing, and equity under the run's Properties. |
| Do the selected settings hold up on other data? | A separate evaluation on data that did not guide selection | An additional historical test. A favorable result is still not a forecast. |
An indicator and a strategy need different preparation. A strategy() supplies its position signals through its orders. An indicator() must provide a compatible position plot: +1 long, -1 short, and optionally 0 flat. An ordinary price plot is not a trading rule. Read Choose a Backtest Signal.
What an Optimizer Score Includes
A study of a strategy() script that you start now is scored on its Executed Trades. It uses the strategy's simulated orders under its Properties, including fill prices, position sizes, commission and slippage. Its profit factor, closed-trade count and account drawdown use the same results as Studio's Strategy Report for the same script, data and Settings. A Sortino or Sharpe score uses per-trade returns, not the Strategy Report's monthly equity returns, so the two values can differ.
A study of an indicator() or of the built-in Lorentzian Classification strategy, and any study started before executed-trade scoring, is scored on Signal Returns. It builds trades from position signals and prices entries and exits at the close of each bar. It divides each trade's gain or loss by its entry price, treating trades as if they used equal amounts of money. It does not simulate order fills or position sizing. Its default zero signal cost excludes fees and slippage. You can set Signal Round-Trip Cost to subtract a flat percentage from every closed signal trade before scoring.
Neither basis scores the price movement of a position still open at the end of the dataset. The study's card in the Study Library names its basis. See Check What the Study Scores.
Choose an objective before you search. Profit Factor, maximum drawdown, and risk-adjusted objectives ask different questions. Robust Sortino and Sharpe scores cap positive ratios and apply a trade-count weight; negative ratios retain their negative value. That weight is not a deduction for trading costs and does not prevent overfitting.
For Signal Returns, Signal Round-Trip Cost applies before every objective and trade metric. Omega's Target Return per Trade is an additional return hurdle after costs; it does not deduct a fee itself. On Executed Trades, costs already come from the script's Properties and an extra signal cost is refused. Do not include an already deducted cost in the Omega target again. Read the objective definitions.
What the Strategy Report Includes
Studio's Strategy Report simulates a strategy's orders using its Properties, including initial capital, position size, commission, slippage, and execution settings. These assumptions can change entry prices, exits, trade counts, and profit figures. The Broker Emulator and Engine Fidelity guide explains the limits of the available data.
For a Signal Returns study, a trial's results can differ from the Strategy Report for the same Settings. For example, a strategy may close a position through an order filled inside a candle. A study that prices a signal change at that candle's close need not measure the same return. Adding commission to the Strategy Report changes that simulation; it does not make those study returns fee-adjusted.
Open a selected trial with Use These Settings, then See It in Studio. Check the List of Trades and the Strategy Report before interpreting the headline result. If comparing with another platform, use the TradingView comparison checklist.
Check Settings Without Reusing the Answer
Optimization can select settings that fit noise in the data you searched. TradingView's official explanation of overfitting describes using separate data for selection and evaluation.
- Choose the split first. Record the symbol, timeframe, dataset, and date ranges. Reserve a later period that will not guide the search. Keep enough earlier history for the script's indicators to initialize.
- Search on the development period. Record the objective, search ranges, trial count, Minimum Trades, and scoring options. Keep unsuccessful trials in your record too.
- Freeze a candidate. Save the exact source and input values before looking at the reserved period. Review its order-based report with explicit costs and sizing.
- Evaluate the reserved period without retuning. Use the same metric definition and simulation assumptions. Record losses, drawdowns, trade count, and unexpected behavior as well as gains.
- Treat changes as a new selection round. If that evaluation makes you change the rules or values, it has influenced the search. It is no longer an untouched test for that revised candidate.
This is a research procedure, not a claim that Studio automatically manages a data split or certifies a strategy. No score, split, or number of trials guarantees future profitability.
Keep a Record You Can Revisit
Keep the script version, input values, data source and date range, warm-up history, engine version, and simulation Properties alongside the result. For a study, also keep its objective and scoring settings. Export source and understand storage; a saved set of Settings is not a backup of your script or dataset.
Continue with AI Edge Studio and Optimizer, your first study, or compare a Studio backtest with TradingView.