Pine Script Strategy Reports in AI Edge Studio
A strategy report in AI Edge Studio explains one backtest of a Pine Script® strategy. It shows the simulated profit or loss, how it built up over time, which trades produced the result, and which simulation settings the run used. Every figure comes from a simulation on past data. The results are hypothetical and do not predict future returns.
Throughout the report, P&L means profit and loss. A positive amount is a profit, and a negative amount is a loss. Some figures count only closed trades, and others also include open positions. Each guide says which kind a figure is.
To open the report:
- Open a strategy in Studio.
- In the default layout, select the Strategy tab beside Chart. If you have moved the tab, select it in the group where you put it. On a narrow screen, the editor and the chart are stacked, so this tab is below the editor.
- Choose Metrics or Trades.
The Strategy tab appears only after a script that declares strategy(...) has run. An indicator has no strategy report, so the tab does not appear for it.
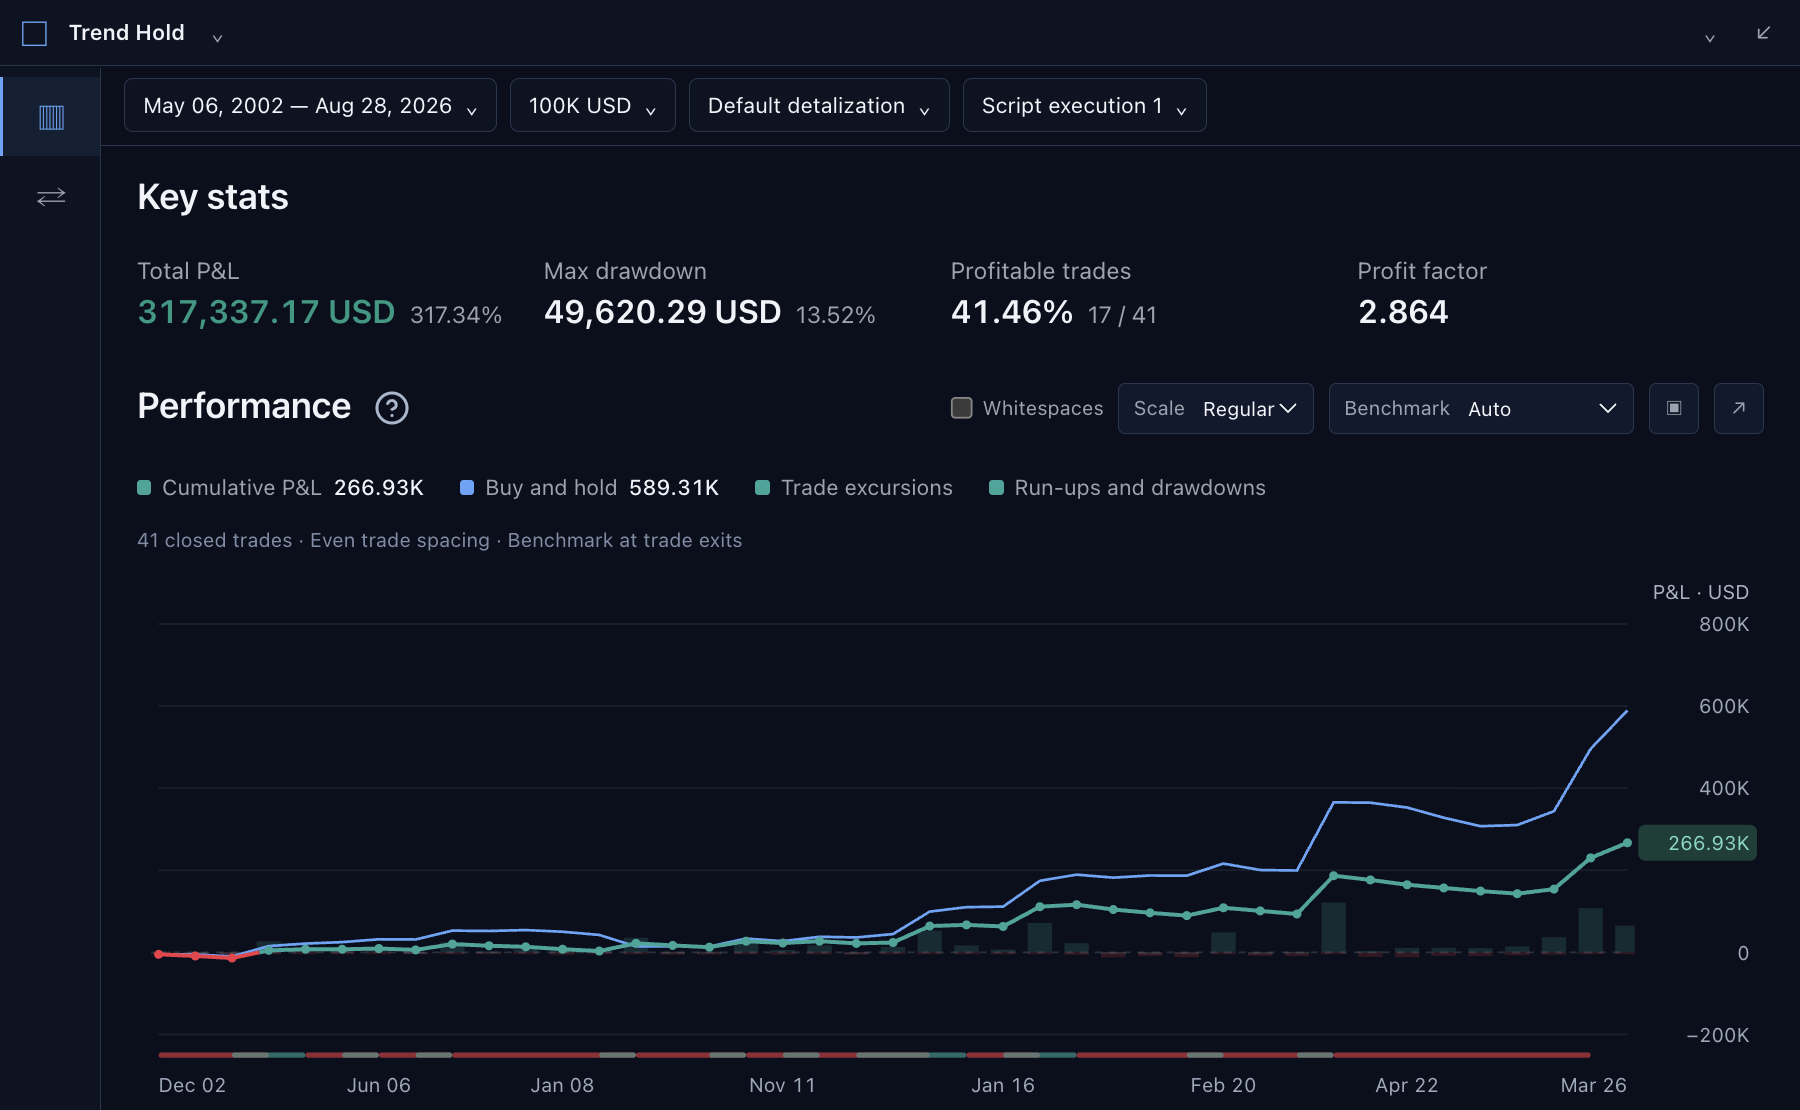
Start with Key stats, then read the Performance chart below. This capture uses the built-in Trend Participation Filter strategy, shown as Trend Hold, with Studio's bundled daily SPY dataset. The displayed settings and results are examples. Select the image to open it at full size.
The question-mark help icon beside a section heading opens the matching guide in a new browser tab. Your run stays open in Studio.
Open a Study Trial in Studio
To see the report for a trial from an optimization study:
- Wait for the study to finish. Use Settings stays locked while the study runs.
- On the study's Results page, choose Use Settings beside the trial.
- Choose See It in Studio. If the button is unavailable, the page shows the reason.
Return to Studio explains more.
When you are signed in, See It in Studio also attempts to save a summary of the trial's strategy report for AI tools. The status message Strategy Report saved for AI tools. confirms that saving succeeded; opening the trial alone does not confirm it. The summary holds the report's figures and the commission and capital settings behind them. It holds no trade list. Up to 50 summaries are kept for each study, and newer replays replace the oldest. An AI assistant connected through the hosted MCP can read the summary saved for the study's best trial next to that trial's score. The summary is a separate measurement and never replaces the score.
A study of a strategy() script that you start now is scored on its Executed Trades, so its profit factor, closed-trade count and account drawdown use the same results as this report. A study scored on Signal Returns, such as an indicator study or an older study, builds trades from position-signal changes priced at bar closes. It does not simulate order fills or apply position sizing, commission or slippage, so its trade counts and profit factor can differ from this report.
A ranking score is still not a report figure. The study's risk ratios use per-trade returns; the report's ratios use monthly equity returns. The study scores only closed trades, while the report's Total P&L also includes open profit or loss. Objectives and Scores explains the difference.
Read the Result
Metrics starts with Key stats: Total P&L, Max drawdown, Profitable trades and Profit factor. The table shows where to find the detail behind each figure and which guide explains it.
For a first review, follow this order:
- Check the run. Confirm the dataset, timeframe, testing period and Properties. Read any stale result or Partial trade detail notice before using the numbers.
- Separate closed and open results. Compare Net P&L with Total P&L. An open position can explain why Total P&L differs from the last point on the Performance chart.
- Read the path and the downside. Inspect Performance and Growth and decline. Check the measurement method and the denominator before comparing drawdown percentages.
- Inspect the trades and costs. Compare win rate with average gains and losses, then open individual trades. Record the settings with the exported report before changing the run.
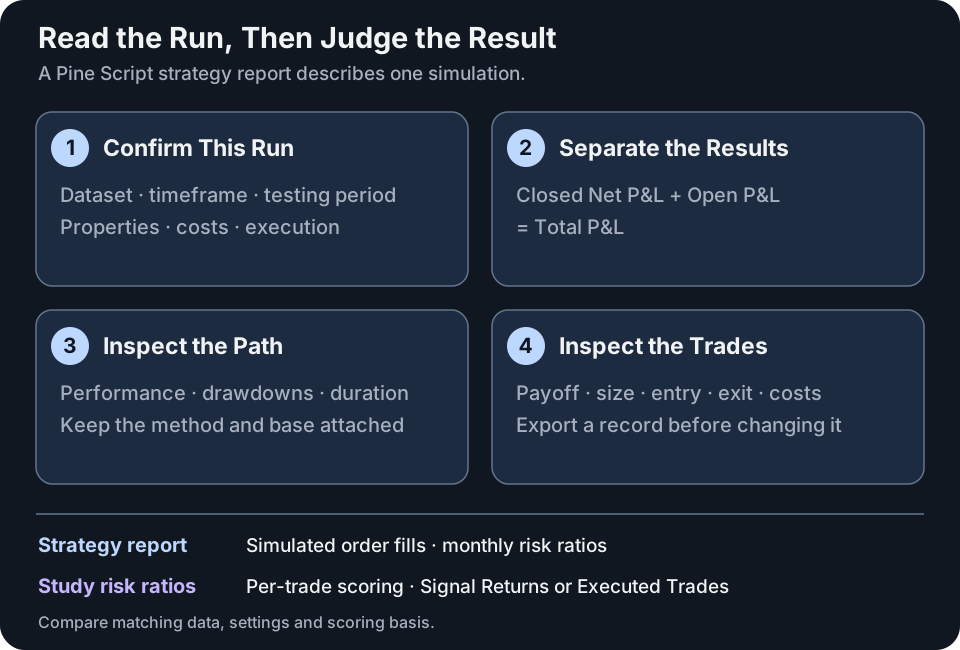
Read the result together with the assumptions that produced it. The report's monthly risk ratios differ from an optimization study's per-trade score, and a Signal Returns study also uses bar-close signal trades instead of fills. This is an explanatory diagram, not a report screenshot.
| What You Want to Understand | Where in the Report | Open This Guide |
|---|---|---|
| How profit accumulated and where the difficult stretches occurred | Metrics, under Performance | Performance Chart |
| Closed profit, open positions, results by period, the buy-and-hold comparison, and monthly risk ratios | Metrics, under Performance analysis: Breakdown, Periodical and Benchmarking. In More views: Returns details and Risk-adjusted performance | Return Details |
| Win rate, the spread of returns, winning and losing streaks, entry timing, and unusually large trades | Metrics, under Trades analysis | Trades Analysis |
| How far equity grew (run-ups) and fell (drawdowns), how long each lasted, and the different drawdown measurements | Metrics, under Performance analysis: Growth and decline | Equity Run-Ups and Drawdowns |
| Starting capital, account growth, and simulated margin use | Metrics, under Performance analysis: Margin usage. In More views: Capital efficiency | Capital Efficiency |
| The entry, exit, costs, and return of an individual closed-trade record | Trades, under List of trades | List of Trades |
The help icon beside Performance analysis opens the Return Details guide. The table also links the guides for its Growth and decline, Margin usage and Capital efficiency views.
To download the report data as a spreadsheet:
- Open the Strategy report menu, the ⌄ beside the strategy name.
- Choose Download data as XLSX.
Studio saves a workbook named after the strategy, ending in -strategy-report.xlsx. It has five sheets: Overview, Performance, Trades Analysis, Risk & Drawdown and List of trades. While a testing period is still recalculating, the menu item is unavailable, and its tooltip reads Wait for the selected testing period to finish recalculating.
Set the Period and Capital
Two buttons above the results set the dates that the report covers and the starting account. One shows the date range, and the other shows the amount and currency.
To change the testing period:
- Select the button that shows the date range. The Testing period list opens.
- Choose Last 7 days, Last 30 days, Last 90 days, Last 365 days or Entire history. To use your own dates, enter a Start date and an End date, then choose Select custom range.
The report recalculates for that period. The period list also shows Range from chart · Default. It is not available in Studio, so choose another period or enter your own dates.
Studio temporarily remembers the testing period, and whether Metrics or Trades is open, for recent strategy and dataset views. Reloading the page clears that memory. A dataset without a remembered period starts on Entire history.
To change the initial capital:
- Select the button that shows the amount and currency.
- Enter the starting capital and choose the currency.
- Choose Apply & recalculate.
Use the Strategy Report Menu
The Strategy report menu, the ⌄ beside the strategy name, has four items:
- Add alert… switches to the Chart tab with a new alert drafted at the last closing price.
- Settings… opens the strategy's settings, with the Inputs, Properties, Style and Visibility tabs.
- Download data as XLSX saves the report as a workbook, as described under Read the Result. It is available once the selected testing period has finished calculating.
- Open strategy… moves the focus to the script in the editor.
Change the Report Panel Size
The buttons in the report header change the size of the whole report panel. Maximize panel fills the workspace, and Restore panel returns it to its usual size. Collapse panel leaves only the title bar, and Open panel opens it again. The arrow on the Performance heading is different: it makes only that chart taller. See how to expand the Performance chart.
Understand the Simulation
| What You Want to Understand | Where in the Report | Open This Guide |
|---|---|---|
| Which prices inside a historical candle the simulation can use | The Default detalization button above the results | Bar Detalization |
| When the strategy evaluates its rules and reacts to fills | The Script execution button above the results | Script Execution |
| How orders become fills, including costs, timing, margin, and data feeds that are not available | Learn more in the Engine fidelity notice below the results. If you closed the notice, reload the page to show it again. | Broker Emulator and Engine Fidelity |
The lists that open from Default detalization and Script execution each have their own help icon.
To change a run:
- Open Settings below the editor, or choose Settings… in the Strategy report menu.
- Use Inputs for the script's input values and Properties for the simulation settings, such as starting capital and trading costs.
- Select Ok to apply your changes.
Keep the same dataset and testing period when you change a setting. Then compare the new run with the earlier one. Look at the Performance chart and at a few individual trades.
Notices and Missing Values
The report marks results that are out of date and data that it does not have. Read the mark before you draw a conclusion. Missing data is not a zero. An option marked feed unavailable did not affect the run.
| You See | What It Means |
|---|---|
| stale result beside the strategy name | The latest run failed. The cause can be a compile error, a runtime error or a connection problem. The numbers come from the last successful run. That run can have different code or settings from those now in the editor. |
| A dash in place of a value | The report could not calculate the value. It is not zero. Many values show the reason when you hold the pointer over them. |
| A Partial trade detail notice | The report keeps the full detail of only part of the closed trades. The notice says how many it kept. See Why Trade Detail Can Be Partial. |
| A feed unavailable label | The option needs price data that the current dataset does not include, so you cannot select it. |
| A Currency conversion unavailable notice | Benchmark values that need a currency conversion are missing. The notice gives the reason. |
| Report has data-quality warnings | Hold the pointer over the line to read the warnings. |
| Selected-period calculation failed | The report could not recalculate the testing period. Choose Retry, or choose Entire history to return to the whole dataset. |
Why Trade Detail Can Be Partial
Studio's simulation keeps the full detail of a closed trade only while the trade's entry order and exit order are both among the run's latest 9,000 filled orders. A long run with many orders therefore loses the detail of its earliest trades. The report then shows a notice that starts with Partial trade detail. and says how many closed trades it kept.
Totals that the simulation reports for the whole run, such as Total P&L, Net P&L and the trade counts, still cover every trade. Views built from individual trades, such as the List of trades, Streaks and Time patterns, cover only the trades that were kept. Labels such as retained detail, partial detail and Retained trade detail only mark those views.
A shorter Testing period has fewer orders, so a run on that period may keep the detail of every trade.
About the Pictures
The guides in this section use two kinds of picture: screenshots and diagrams.
The screenshots show AI Edge Studio running the built-in Trend Participation Filter strategy with its bundled SPY dataset. Trend Hold is its short title in the editor and Settings. The pictures show where to find and read the controls. Their values are examples, not suggested settings. Select a picture to open it at full size.
The diagrams use small, invented examples to explain a calculation or sequence. They are original illustrations, and their values do not match the results in the screenshots.