Return Details: Profit Factor, Sharpe and Sortino
In AI Edge Studio, the Performance analysis section of a Pine Script® strategy report shows how much profit or loss came from closed trades and how much remains in open positions. It also groups results by period, compares the strategy with buying and holding, and reports the Sharpe and Sortino ratios from monthly equity returns. These ratios compare returns with how much those returns vary. P&L is short for profit and loss. These figures come from a simulation on past data. They are hypothetical and do not predict future returns.
Find This View
- Open a strategy in Studio.
- Select the Strategy tab, then Metrics.
- Scroll to Performance analysis. The help icon beside that heading opens this guide.
The section has five tabs and a list of three more views:
- Breakdown is the first tab. The other tabs are Periodical, Benchmarking, Margin usage and Growth and decline.
- The More views list beside the tabs holds Returns details, Risk-adjusted performance and Capital efficiency.
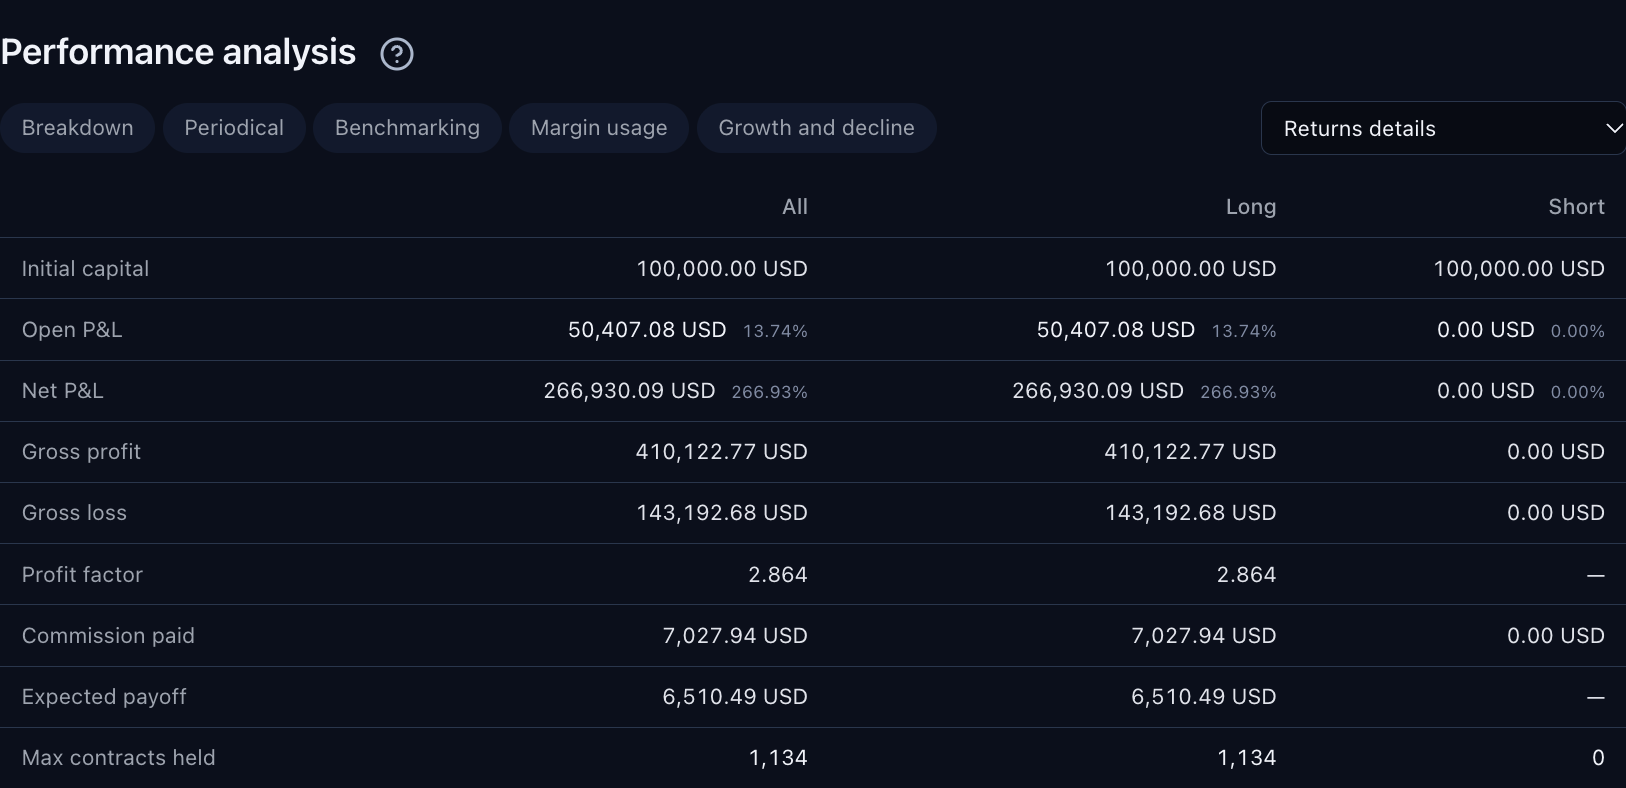
Choose More views → Returns details to open this table. The All, Long and Short columns separate the combined result from each trading direction. Select the image to open it at full size.
This capture uses the built-in Trend Participation Filter strategy with Studio’s bundled SPY dataset. The displayed settings and results are examples.
Compare a number only with another number of the same kind. Net P&L (realized results, including paid entry commission on positions still open), Total P&L (Net P&L plus the open position’s price gain or loss) and an optimization study's score each measure something different.
What Each View Shows
| View | Use It For | Where to Read More |
|---|---|---|
| Breakdown | Gross profit, gross loss, profit factor, commission load, and closed trades grouped by signal or by side | Start With Breakdown |
| Periodical | Closed-trade results grouped by day, week, month, quarter or year | Read Results by Period |
| Benchmarking | The strategy beside a buy-and-hold position | Compare Direction and Benchmark |
| Margin usage | Margin used at bar close, margin calls and liquidations | Capital Efficiency |
| Growth and decline | Run-ups and drawdowns, with their sizes and durations | Equity Run-Ups and Drawdowns |
| More views → Returns details | The table of results for All, Long and Short trades | Read the Profit Structure |
| More views → Risk-adjusted performance | Sharpe and Sortino ratios from monthly equity returns | What the Risk-Adjusted Ratios Mean Here |
| More views → Capital efficiency | CAGR, account size required and return on capital | Capital Efficiency |
Read the Profit Structure
Returns details has nine rows, each shown for All, Long and Short trades. The table below explains them. Some terms also appear elsewhere in the report:
- Net P&L, Gross profit, Gross loss and Profit factor also appear in Breakdown. There, commission appears as the Commission column and the Commission load card.
- Open P&L, Expected payoff and Max contracts held appear only in Returns details.
- Total P&L is not a row. It appears in Key stats and in the Profit structure chart.
| Report Term | How to Read It |
|---|---|
| Initial capital | The starting account balance. The same amount appears in every column. |
| Net P&L and Total P&L | Net P&L starts with closed-trade profit or loss after costs and also deducts paid entry commission on positions that are still open. Total P&L is Net P&L plus Open P&L. For example, a Net P&L of 600 plus an Open P&L of 100 gives a Total P&L of 700. |
| Open P&L | The unrealized price gain or loss of positions that are still open. Their paid entry commission is already counted in Net P&L, so do not subtract it again. The Net P&L percentage uses initial capital; the Open P&L percentage uses initial capital plus the report’s Net P&L. With an initial capital of 1,000, a Net P&L of 600 shows 60% and an Open P&L of 100 shows 6.25%. |
| Gross profit, gross loss, and commission | Gross profit is the total of the winning trades. Gross loss includes closed losing trades and paid entry commission on positions still open. Returns details shows gross loss as a positive amount. Each trade's result is counted after its trading costs. Commission paid shows all paid commission, including open-position entry fees, on its own row. Do not subtract it from results that are already net: that would count the cost twice. |
| Profit factor | Gross profit divided by gross loss. A gross profit of 900 against a gross loss of 300 gives 3.0. The report shows a dash when gross loss is zero. Paid entry commission on an open position can make gross loss positive even when no closed trade lost money. |
| Expected payoff | Net P&L divided by the number of closed trades. A Net P&L of 600 across 20 closed trades gives 30 per trade. Paid entry commission on positions still open can make this differ from the mean P&L of the closed-trade rows. It does not predict the result of the next trade. A column with no closed trades shows a dash. |
| Max contracts held | The largest position the run held at one time, in contracts, shares or units, as reported by the simulation. If the simulation does not report it, the row shows a dash. Hold the pointer over the dash to see the reason. |
An Illustrated Example
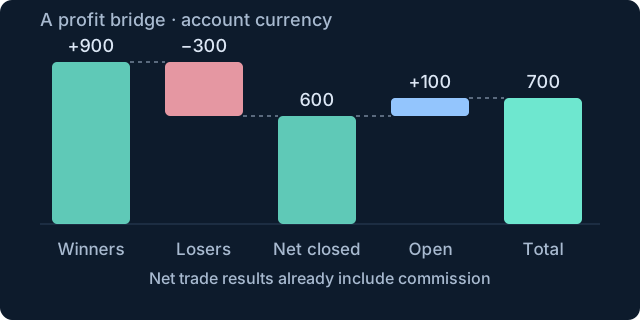
Original illustration using invented values and no outstanding open-position entry commission. Closed winners contribute 900 and closed losers cost 300, leaving 600 in net closed profit. Another 100 remains open, bringing Total P&L to 700. Commission is disclosed separately and is already included in net trade results. Select the image to open it at full size.
Paid Entry Commission on an Open Position
Report totals do not always equal the sum of closed-trade rows. Consider a synthetic run with one closed trade that earned 8 after its entry and exit commissions, plus an open position with a price gain of 10 and an entry commission of 1 already paid:
- Net P&L is 8 − 1 = 7; Open P&L is 10; Total P&L is 7 + 10 = 17.
- Gross profit is 8 and Gross loss is 1, so Profit factor is 8, even though the only closed trade won.
- With one closed trade, Expected payoff is 7. The closed-trade row itself still shows a net result of 8.
The Commission paid total includes the open entry’s fee. A closed-trade row’s commission includes only that closed trade’s own entry and exit fees. The report has already deducted these costs; do not subtract the commission row again.
Start With Breakdown
Breakdown is the first tab and opens by default. Its four cards show Gross profit, Gross loss, Profit factor and Commission load. Commission load is commission paid as a percentage of gross profit. It shows a dash when there is no gross profit.
Below the cards, Profits and losses lists closed trades grouped by entry signal. To compare long and short trades, change Group trades from By signals to By side. The columns are Net P&L, Trades, Gross profit, Gross loss and Commission.
The Profit structure chart shows Total profit, Total loss, Commission and Total P&L. Total profit and Total loss use the report’s gross profit and gross loss, including paid entry commission on positions still open in the loss amount. Total P&L also includes the open position, so it can differ from Total profit minus Total loss. The Benchmarking chart beside it is described under Compare Direction and Benchmark.
Read Results by Period
Periodical groups closed trades by the date on which they exit. It opens on Month and All trades. Set Direction to All trades, Long or Short. Set Period to Day, Week, Month, Quarter or Year. Each row shows Net P&L, the number of trades, the win rate and commission for that period.
A trade counts in the period in which it closes. A position held across several periods therefore shows its whole result in the last one. Periods without a closed-trade exit have no row; they are not displayed as zero-return periods. Weeks start on Monday.
The line above the table ends with the time zone used for the dates. It is the chart’s time zone, which is UTC unless you change it, so a date here can differ from the date in the List of trades. Why Exported Dates Can Differ explains the difference.
When the report keeps only part of its trade detail, Periodical groups the kept trades only, and the line above the table adds Retained trade detail only. When some trades have no usable profit or date, the line also says how many were left out.
Compare Direction and Benchmark
Returns details shows each number for All, Long and Short trades. A report can keep only part of its closed-trade list. In that case a notice that starts Partial trade detail. appears above Performance analysis, and the affected columns are marked partial detail. Read the notice before you interpret the Long and Short totals. Why Trade Detail Can Be Partial explains the cause.
Benchmarking compares the strategy with a buy-and-hold position. That position invests all of the initial capital at the price of the strategy's first entry. Three cards summarize the comparison:
- Strategy return is Total P&L as a percentage of initial capital, so it includes any open position.
- Buy and hold return is the buy-and-hold result at the end of the report, as a percentage of initial capital.
- Strategy outperformance is the strategy's Net P&L minus the buy-and-hold profit at the end of the report. The card shows this difference as a percentage of initial capital, with the amount below it. It leaves out the open position’s unrealized price gain or loss but includes its paid entry commission through Net P&L, so it does not necessarily equal the difference between the first two cards.
The benchmark is a price-based comparison. Its calculation makes no separate commission deduction or dividend-reinvestment calculation. It therefore includes dividends only when the dataset's prices are already adjusted for them.
Correlation at bar closes shows how closely the strategy's running profit and loss moved with the buy-and-hold profit and loss, from the first entry. A value near 1 means they rose and fell together. A value near −1 means they moved in opposite directions. It needs at least three bars, and it shows a dash when either result never changes.
This is a correlation of cumulative P&L levels, not of daily or per-trade returns. Two paths that both rise during the test can show a value near 1 even when their moves from bar to bar are unrelated. Read it as a description of these two paths over this test, rather than as a prediction of how they will move next.
Strategy vs benchmark lists both results for each period as a percentage of initial capital. It opens on Weekly. Use Period to choose Daily, Weekly, Monthly, Quarterly or Yearly. The Strategy column counts each closed trade in the period in which it exits. The Buy and hold column shows the change in the value of the buy-and-hold position over that period. The periods use the chart’s time zone, which the line above the table names. When trade detail is partial, that line adds retained strategy trade detail only.
The Benchmarking chart shows the maximum, current and minimum return for the strategy and for buy and hold. In this chart, the strategy is blue and buy and hold is orange. The chart takes its values at closed-trade exits, and the cards measure at the end of the report. The chart's current value can therefore differ from a card.
What the Risk-Adjusted Ratios Mean Here
To see the ratios, choose More views → Risk-adjusted performance. The table has two rows, Sharpe ratio and Sortino ratio. Both are monthly ratios that the report does not annualize, so compare them only with other monthly ratios. The report calculates them like this:
- Risk-free rate. You set the annual risk-free percentage in the script, with
risk_free_ratein thestrategy()declaration. You do not set it on the Properties tab of the strategy settings dialog. If the script does not specify it, Studio uses 2%. Studio divides the annual percentage by 12 to obtain the monthly rate. - Sharpe ratio. Compares excess return with the variability of all monthly returns. Excess return is the average monthly return minus the monthly risk-free rate.
- Sortino ratio. Compares the same excess return with only the deviations below the monthly risk-free rate.
Both denominators divide their squared deviations by the total number of monthly returns before taking the square root. Sharpe uses deviations from the mean return. Sortino uses only the below-risk-free deviations in the sum, but still divides by the total count, including the other months.
The Sharpe ratio and Sortino ratio choose the equity data in this order:
- If the report has a complete, usable closed-trade path, they use realized equity, which is equity built from closed trades only. They leave out the first observed UTC month, which is usually a partial month.
- Otherwise, including a run with no closed trades, they use the available bar-by-bar equity history, which includes open positions.
The monthly boundaries use UTC, regardless of the chart's time zone. The calculation takes the first available equity observation in each observed UTC month and measures the change to the next one. It does not synthesize month-end prices or insert a value for a month with no equity observation. Changing the chart's time zone can change the grouping in Periodical without changing these risk-ratio boundaries.
Realized equity changes when a trade closes. Holding the same exposure but closing and reopening at a different cadence can therefore change these ratios, even before costs change the result. Do not use the realized ratios alone to compare strategies with very different closing frequencies.
A ratio shows a dash when the report has no completed monthly return, for example when the test period is too short. The Sharpe ratio also shows a dash when the monthly returns do not vary. The Sortino ratio also shows a dash when no monthly return falls below the risk-free rate. Hover over the dash to see the reason.
A Small Monthly Example
For arithmetic only, suppose the usable monthly returns are 0% and 2%, and the script sets the annual risk_free_rate to 0. The mean return is 1%, and the population standard deviation is 1%, so the report's Sharpe ratio is 1% ÷ 1% = 1. Neither month is below the risk-free rate, so Sortino has a zero denominator and shows a dash. A missing ratio does not mean a return of zero. These invented inputs explain the calculation; they are not recommended settings.
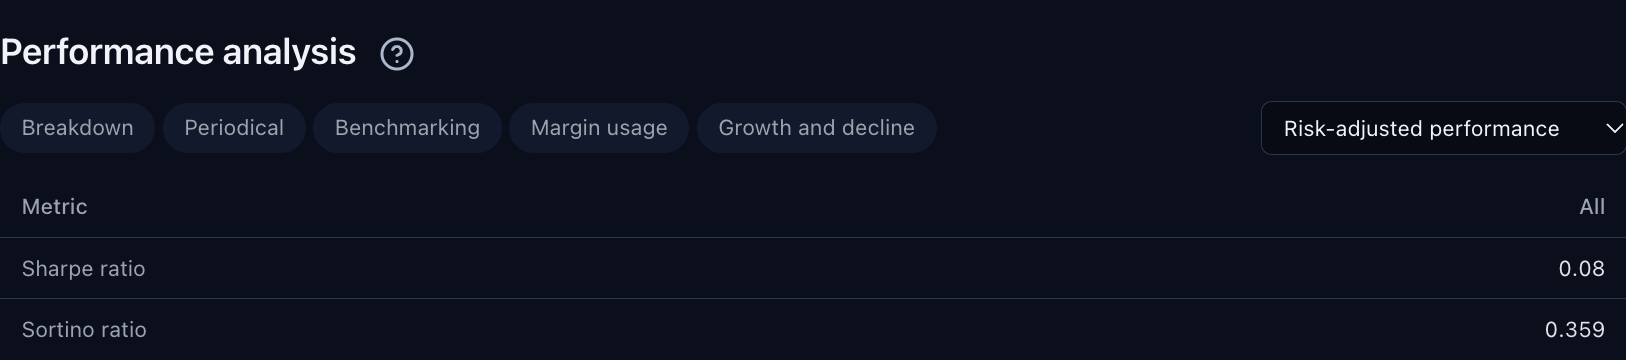
Choose More views → Risk-adjusted performance to see the Sharpe ratio and Sortino ratio. Both use monthly equity returns and can differ from the per-trade score shown in an optimization study. Select the image to open it at full size.
Do not expect these ratios to equal an optimization study's score, even when the names are similar. The report calculates the Sharpe ratio and the Sortino ratio from monthly equity returns, and it does not annualize them. A study's Robust Sortino Score, Traditional Sortino Ratio, Robust Sharpe Score or Traditional Sharpe Ratio uses its own per-trade scoring method. For the study-ranking calculations, see Objectives and Scores.