List of Trades: Inspect and Export Backtest Trades
The List of trades in AI Edge Studio shows the closed-trade records in a Pine Script® backtest. Each record pairs an entry with the quantity closed by an exit. A partial exit can create a record while the rest of the position stays open. Use the list to check the entry and exit behind a number in the report. Each record has two rows, the Exit row on top and the Entry row below it.
Find This View
- Open a strategy in Studio.
- Select the Strategy tab.
- Select the Trades tab in the report.
The List of trades table opens. The help icon beside the List of trades heading opens this guide.
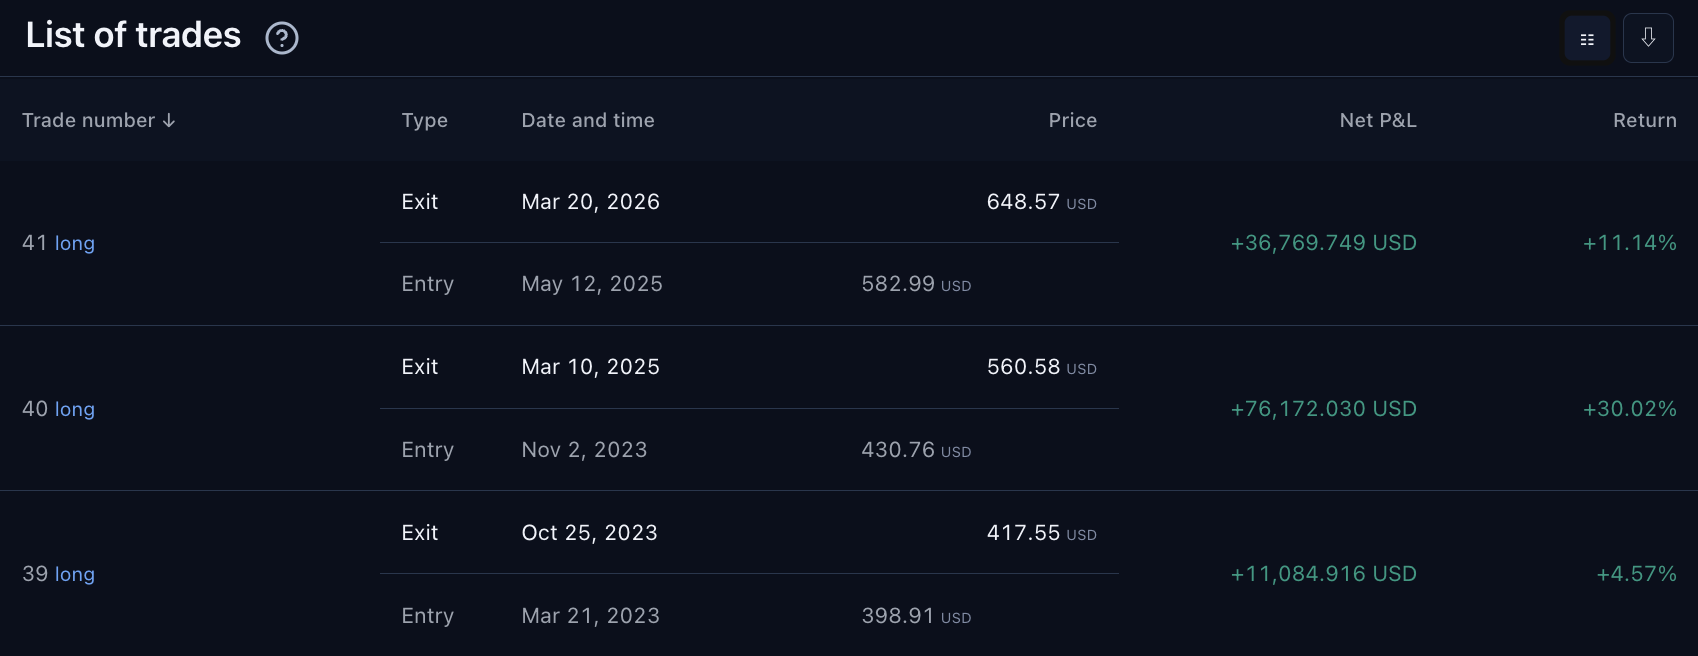
Select a trade number to find its exit on the chart, or select its Entry row to find the entry. Two icon buttons sit at the right of the List of trades heading: Column setup, then the download arrow. Size and Commission are hidden in this capture using Column setup. Select the image to open it at full size.
This capture uses the built-in Trend Participation Filter strategy with Studio’s bundled SPY dataset. The displayed settings and results are examples.
Before you change the strategy, find out why a trade won or lost. Check its entry, exit, size, and costs.
Follow an Entry Through to Its Exit
To see a trade on the chart:
- Select the trade number, for example 41 long, to move the chart to the trade’s exit.
- Select the trade’s Entry row to move the chart to its entry.
Both actions bring the Chart tab to the front. What happens to the report depends on where it is:
- The report shares a pane with the chart. This is the starting layout. The chart replaces the report. Select the Strategy tab to return. The Trades tab reopens, but your column choices, sort order, and extra loaded trades return to their defaults.
- The report is in its own pane. The report stays open beside the chart and keeps those settings.
To move the report to its own pane, right-click the Strategy tab, choose Move Tab to New Pane, and pick a side.
Read Each Column
The table opens with these columns: Trade number, Type, Date and time, Price, Size, Net P&L, Return and Commission. Five more columns are hidden at first: Signal, Favorable, Adverse, Cumulative P&L and Duration. To show them, select Column setup, the first of the two icon buttons beside the List of trades heading.
| Column | How to Read It |
|---|---|
| Trade number | Identifies one closed-trade record. long or short gives its direction. The remaining open quantity has no row until it closes. An exit that closes several entries can create several records. |
| Type | Marks each row as Exit or Entry. |
| Date and time | The bar of that entry or exit, in the symbol’s time zone. Intraday bars show a date and time. Daily or longer bars show the trading date only. Why Exported Dates Can Differ explains why other views can show a different time. |
| Signal | The order behind the row: its comment, or its ID if it has no comment. |
| Price | The price at which the simulation filled that order, in the symbol’s currency. |
| Size | The quantity filled. Below it is the value of the position at entry (the entry notional), in the account currency. |
| Net P&L | The trade’s profit or loss after trading costs. |
| Return | Net P&L divided by the entry notional, including the symbol’s point value and currency conversion when supplied. It measures this one trade. It is not the percentage change of the whole account. |
| Commission | The commission recorded for the trade, in the account currency. Net P&L already includes it, so do not subtract it again. Broker Emulator and Engine Fidelity explains how fees apply. |
| Favorable | The largest gain the position reached while it was open, as an amount and as a percentage of the entry notional. It helps explain what happened between entry and exit. It is not added to the trade’s Net P&L. |
| Adverse | The largest loss the position reached while it was open, shown as a negative amount and as a percentage of the entry notional. It is not added to the trade’s Net P&L. |
| Cumulative P&L | The running total of profit and loss from closed trades, up to and including this trade. |
| Duration | The number of bars from the trade’s entry to its exit, not counting the entry bar. A trade that opens and closes on the same bar shows 0 bars. Average bars in trades in Trades Analysis counts both bars, so it is 1 higher for the same trades. |
Find and Export the Trade You Need
- Change the order. The table opens with the highest trade number at the top. Select the Trade number column heading to reverse the order. The Exit row stays above the Entry row in both orders. Trade number is the only column you can sort by.
- Choose the columns. Select Column setup, then turn columns on or off. Select Reset columns in the same menu to return to the starting set.
- See more trades. The table first shows up to 250 trades. If the run has more, scroll to the end of the table and select the button there, for example Load 250 more trades. The number on the button is how many trades it adds.
To download the trades, select the download arrow, the second icon button at the right of the List of trades heading. Its tooltip reads Download data. Studio saves a file named strategy-trades.csv, which you can open in a spreadsheet.
The file holds the closed trades for the selected testing period, including trades that the table has not loaded yet. It holds every column, whatever Column setup shows. Showing or hiding columns changes only what you see in the table. It does not change the run or the file.
The file is laid out differently from the table:
- Trades run from the lowest trade number to the highest, whatever order the table shows. Each trade has an Exit row followed by an Entry row.
- The Event column holds Exit or Entry, and the Type column holds Long or Short.
- The Date/Time column records the bar’s time in UTC, in ISO 8601 format, for example
2024-03-01T14:30:00.000Z. On daily or longer bars, its calendar date can differ from the date in the table. - Amounts and percentages are plain numbers, without currency codes or percent signs. A Return of 5.8 means 5.8%.
- The Exit row holds the trade’s results. The Entry row leaves the result columns empty.
The columns, in order, are Trade #, Event, Type, Date/Time, Signal, Price, Size, Net P&L, Return, Favorable, Adverse, Cumulative P&L, Duration (bars), Commission, Size (value), Favorable (%), Adverse (%) and Cumulative P&L (%). The last four columns add these values:
- Size (value) is the entry notional, in the account currency.
- Favorable (%) and Adverse (%) are percentages of the entry notional.
- Cumulative P&L (%) is a percentage of the initial capital.
In a partial list, the Trade # column uses the same Retained labels as the table.
To download the whole report, including the list of trades, open the Strategy report menu, the ⌄ beside the strategy name, and choose Download data as XLSX. It is unavailable until the selected testing period finishes calculating. If the calculation fails, choose Retry, or choose Entire history.
The workbook’s List of trades sheet has the same columns as the CSV file, but three have different names: Timestamp (ISO 8601 UTC) in place of Date/Time, Return % in place of Return, and Duration bars in place of Duration (bars).
Why Exported Dates Can Differ
The views of the report do not all use the same time zone. One trade can therefore show different times, and sometimes different dates, in different places.
| Where | Time Zone |
|---|---|
| List of trades | The symbol’s own time zone. If Studio cannot use that time zone, it uses Coordinated Universal Time (UTC). |
| Performance chart, Periodical, Strategy vs benchmark and Time patterns | The chart’s time zone. It is UTC unless you change it. To change it, right-click the time scale at the bottom of the market chart and choose Time zone. |
| The downloaded CSV and XLSX files | Always UTC. |
For example, the S&P 500 ETF (SPY), 5-minute sample is in UTC-4, so 09:30 in the List of trades is 13:30 UTC. An exit at that time shows as 1:30 PM on the Performance chart’s trade card. An entry at that time falls in the 13:00 group of Time patterns. The download records it as 13:30 UTC.
For daily or longer bars, Studio also adjusts the bar’s timestamp to choose the trading date displayed in the table. A session that opens in the evening belongs to the next day. The downloaded timestamp keeps the original time.
For example, each daily bar in Studio’s bundled OANDA EURUSD 1D dataset opens at 21:00 UTC on the evening before its trading day. A trade on the bar for Monday, May 6, 2002 appears like this:
- List of trades: May 6, 2002.
- The Performance chart’s trade card, for an exit: May 5, 2002, 9:00 PM.
- Time patterns, for an entry: the Sunday group.
- The download:
2002-05-05T21:00:00.000Z.
Match a trade by its trade number and its Entry or Exit row, rather than by date alone.
Check the Testing Period
The list and its download cover only the report’s testing period. The date range button above the report shows that period and opens Testing period. A new report starts on Entire history.
When you choose a shorter period, Studio recalculates the strategy on only the bars in that period. The trades can then differ from the full-history run.
If you see No closed trades in this testing period. and no Partial trade detail notice, choose Entire history or a wider range. If the period already covers the entire history, the run has no closed trades to list. If a Partial trade detail notice is also shown, read its count: the run closed trades, but the details of none of them were kept.
Understand a Partial List
Some runs keep the detail for only part of their closed trades. Studio keeps a closed trade’s detail only while its entry and exit orders are among the run’s latest 9,000 filled orders, so a long run with many orders loses the detail of its earliest trades. When that happens, a notice that starts with Partial trade detail. appears above the table. It states how many closed trades the run kept.
In a partial list:
- A row can show a label such as Retained 1 in place of its trade number. The original trade number is unknown, so the label numbers the row among the trades that were kept.
- Cumulative P&L can show a dash. This happens when the profit from the earlier, missing trades is unknown.
- The table and the downloaded file hold only the trades that were kept. Neither can recreate the trades that were left out.
A shorter testing period has fewer orders, so the run may keep the detail of every trade. Why Trade Detail Can Be Partial explains more.
Read the Trades Through an Assistant
Through the AI assistant connection, which comes with the Max plan and is in beta, an assistant can get a trial's trades without opening Studio. This works for a completed cloud trial of the official built-in strategy. Optimizer runs the trial again on the study's stored data and returns the trades only when they match the saved score. These are the bar-close trades the score used, not the rows in this table.
When you ask for the trades, name the study and the trial number. The reply is one of three kinds:
- computing: the trades are not ready. Wait for
retry_after_seconds, then make theretry_call. - refused: read the reason. A refusal is not an empty list.
- ready: the trades are verified. Check
total_trades, then usenext_callfor the next page.
Only a ready reply with total_trades: 0 means the trial closed no trades. If page_state is changed, use refresh_call before you rely on that page.
An Illustrated Example
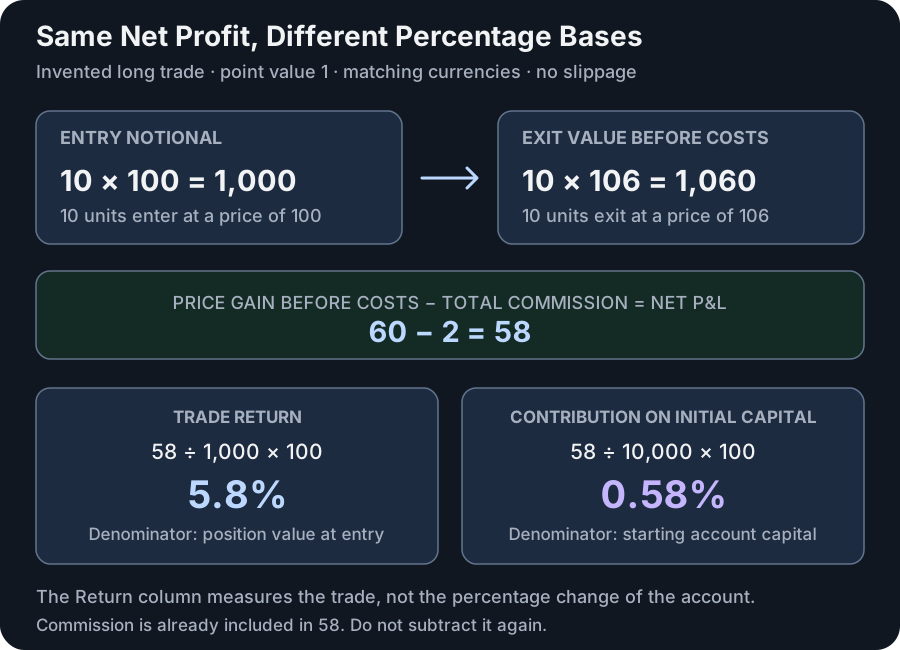
Original illustration using invented values, with one point of value per unit, matching symbol and account currencies, and no slippage. Ten units enter at 100 and exit at 106, earning 60 before costs. Total commission of 2 leaves Net P&L of 58. Return is 58 ÷ 1,000 = 5.8% of entry notional. Relative to 10,000 of initial capital, that same profit contributes 0.58%. These percentages answer different questions. Select the image to open it at full size.
To reconcile this trade with the report, use its net amount of 58 once. Do not subtract the 2 of disclosed commission again. If it were the only closed trade, Net P&L would be 58; an open position could still make Total P&L different. Return Details explains those totals.