Bar Detalization: OHLC Fill Order in Backtests
A historical candle records four prices for its period: the open, high, low, and close (OHLC). Bar detalization is the level of price detail that a Pine Script® strategy backtest in AI Edge Studio steps through inside each candle.
Studio uses Default detalization for every run. It steps through those four prices. High detalization is disabled, because it needs smaller candles that Studio’s data does not include.
In Studio’s detalization controls, a tick is one simulated price step. It is not a trade recorded on an exchange.
Find This View
- In the row of controls above the strategy report, select Default detalization.
- Read the Bar detalization popover. It lists two levels, Default detalization and High detalization. A check mark shows the level the run uses.
The popover is for information. Nothing in it can be changed.
If the row of controls is missing, the report is in a reduced view. When the Performance chart is expanded, open Metrics and select the arrow button at the end of the Performance heading row. When the report panel is collapsed to its title bar, select Open panel. These are separate from maximizing the report panel; see Change the Report Panel Size.
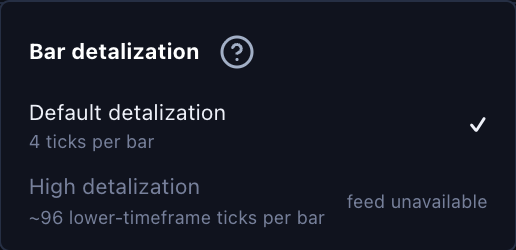
Default detalization is selected. Its 4 ticks per bar are the four candle prices: open, high, low, and close. High detalization is disabled and shows feed unavailable, because it needs lower-timeframe bars (smaller candles inside each chart candle). Select the image to open it at full size.
This capture uses the built-in Trend Participation Filter strategy with Studio’s bundled SPY dataset. The displayed settings and results are examples.
The two levels compare as follows:
| Level | What the Simulation Steps Through | Label in the Popover | Available in Studio |
|---|---|---|---|
| Default detalization | The four prices of each candle: open, high, low, and close | 4 ticks per bar | Yes, used by every run |
| High detalization | Lower-timeframe bars inside each candle | ~96 lower-timeframe ticks per bar | No, marked feed unavailable |
The ~96 in the High detalization label is fixed text in the popover. Studio does not calculate it from your data. No run uses High detalization, so its label says nothing about your results.
Check which level has the check mark. At the Default detalization level, the steps inside a candle are simulated. When one candle contains both your stop price and your target price, the simulated path decides which one fills first.
What Default Means in Studio
Default detalization means that the simulation uses only the four prices of each candle: open, high, low, and close (OHLC). The candle does not record the order in which the market reached those prices, so the simulation assumes an order. It processes orders inside the bar in that assumed order.
The four prices define the path's turning points. Between them, the emulator assumes continuous price movement, so an eligible stop or limit can fill at a price crossed between two turning points. Fills are not restricted to the four quoted candle prices.
Studio picks the order for each candle from the position of the open:
- When the open is nearer the low than the high, the simulated path runs open, low, high, close.
- Otherwise, the path runs open, high, low, close. This includes a candle whose open is exactly midway.
These are the two sequences in the illustration below.
The assumed order matters when one candle contains both your stop price and your target price. The candle’s four prices do not show the real sequence of trades in the market, so they do not show which of the two prices was reached first. The simulation decides that from its assumed order.
For example, take a long position that is already open when the candle starts. Its stop is below the open and its target is above the open. When the path goes to the low first, the stop fills before the target. When the path goes to the high first, the target fills before the stop. The real market may have reached the two prices in the other order.
For a numeric example, suppose the candle has open 94, high 110, low 90 and close 105. A long position has an active stop at 92 and target at 108, with no slippage or additional limit verification. The open is closer to the low (4 points away) than to the high (16 points away), so Studio follows 94 → 90 → 110 → 105 and reaches the stop at 92 first. The later move above the target does not change that earlier simulated exit. These are invented prices, not an observed sequence of market ticks.
Why High Detalization Is Unavailable
The data available to a run sets the most detail the run can use. High detalization needs lower-timeframe bars, and Studio does not currently supply them for any dataset. The option is therefore disabled. You cannot enable it by changing a checkbox or by selecting a larger testing period, because neither adds the missing bars.
Lower-timeframe bars are the smaller candles inside one chart candle. They are also summaries of market activity. They are not a complete record of every exchange tick.
Price Steps and Script Calculations Are Different
Bar detalization sets the prices that the broker simulation steps through. It does not set how often your script calculates. The broker simulation can process prices between script calculations.
On bar close is always on and is the baseline calculation mode. To also make the script calculate at the simulated price steps of historical bars, turn on On history bar tick. You can do this in two places, and each applies the change differently.
In the Script execution popover, next to Default detalization above the report, the change applies as soon as you select the checkbox.
To change it in the strategy’s settings:
- Open the Strategy report menu, the ⌄ beside the strategy name, and choose Settings….
- Select Properties and find Detalization and execution.
- Select On history bar tick.
- Select Ok. If you select Cancel or close the dialog, Studio discards the change.
Properties also shows Bar detalization, set to Default · 4 ticks per bar with a feed unavailable label. It is read-only there as well.
To understand the calculation modes, read Script Execution. To see which features need additional price feeds, read the Engine fidelity notice below the report. It stays there until you close it, and Broker Emulator and Engine Fidelity explains it.
Before you decide that your strategy rules caused a change in the result, compare runs that use the same dataset, testing period, and execution settings.
An Illustrated Example
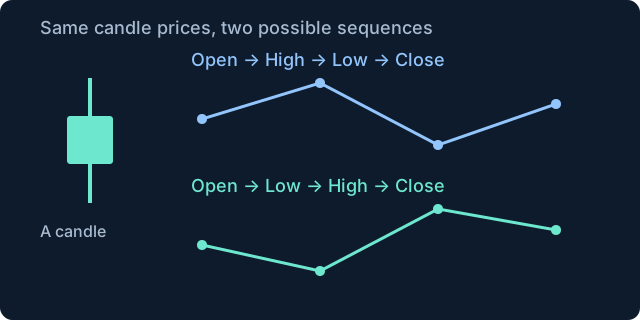
Original illustration using invented values to explain the concept. Four known candle prices can form more than one possible path. This example shows two: open → high → low → close, and open → low → high → close. Both visit the same four prices in a different order. They are simulated sequences, not recorded ticks. Select the image to open it at full size.
Continue Exploring
- Script Execution: when your script calculates.
- Broker Emulator and Engine Fidelity: how orders become simulated fills, and what the engine fidelity notice means.
- List of Trades: the entry and exit of each trade.
- Save and Reuse Settings: the strategy’s Properties.
- All Strategy Report Guides