Capital Efficiency: CAGR, Margin and Account Size
In AI Edge Studio, capital efficiency compares a Pine Script® backtest's result with its starting account balance (initial capital) and with the money needed to support its positions (margin). Read it together with drawdown and the strategy's leverage settings. A higher return on margin can result from a smaller denominator, even when the strategy earns the same amount.
Find This View
The capital and margin values are in two views of the Performance analysis section.
- Open a strategy in Studio, select the Strategy tab, then choose Metrics.
- Scroll to Performance analysis.
- For the margin chart and the margin values, select the Margin usage tab.
- For compound annual growth rate (CAGR), the account size required and the comparison of all, long and short trades, open More views and choose Capital efficiency.
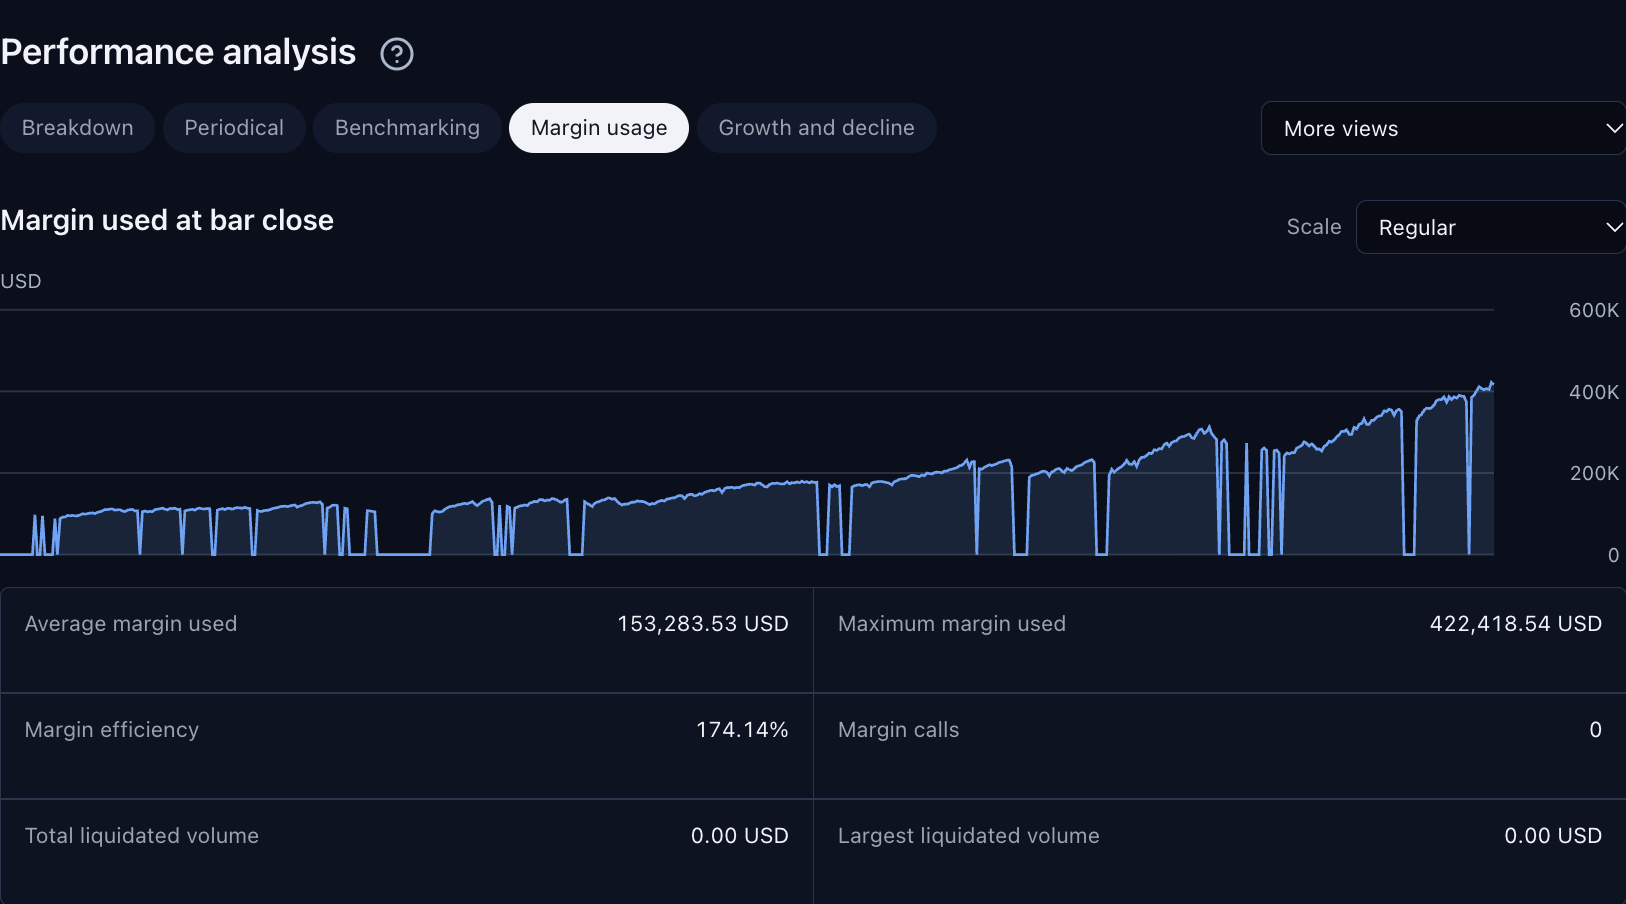
The Margin usage tab under Performance analysis shows the margin values and the Margin used at bar close chart. Read them together with the strategy’s leverage settings. Select the image to open it at full size.
This capture uses the built-in Trend Participation Filter strategy with Studio’s bundled SPY dataset. The displayed settings and results are examples.
A capital-efficiency number describes one simulated run. It does not guarantee that an account of the same size will cover future losses.
Read Capital Efficiency
The Capital efficiency view shows CAGR and Account size required as cards. Below the cards, a table compares All, Long and Short trades.
| Report Term | How to Read It |
|---|---|
| Return on initial capital | The report’s Net P&L divided by initial capital, shown as a percentage. It excludes open positions’ unrealized price gains or losses, but includes their paid entry commission, so it can differ from both closed-trade P&L and Total P&L. Return Details explains Net P&L and Total P&L. |
| CAGR | Compound annual growth rate: the steady yearly rate that would turn the initial capital into the ending equity over the test. Read it from the card. The table row shows a dash in every column, because CAGR describes the whole strategy. How CAGR Is Calculated gives the details. |
| Account size required | An estimate from Studio’s simulation engine: the maximum margin used plus the maximum intrabar drawdown. The Long and Short columns show a dash because the account size is not reported for each direction. If the strategy never held a position, the simulation reports no value, and the All column also shows a dash. Hold the pointer over a dash to see the reason. |
| Return on account size required | The report’s Net P&L divided by Account size required, shown as a percentage. The Long and Short columns use their direction’s Net P&L and the same overall account size. The report shows a dash when Account size required is unavailable or zero. |
| Net P&L as % of largest loss | The report’s Net P&L divided by the size of the largest losing closed trade, shown as a percentage. Each column uses its own trades. For example, 150% means Net P&L is 1.5 times the largest loss. The report shows a dash when there is no losing closed trade. When the report holds only part of the trade detail and the result has no full-run figures, the All column also shows a dash. Hold the pointer over the dash to see the reason. |
Paid entry commission on an open position can reduce the Net P&L used by these ratios before that position closes. See the worked example.
How CAGR Is Calculated
CAGR compares the account equity at the end of the testing period with the initial capital, and spreads that growth over the calendar time the period covers.
- Ending equity is the account equity at the last bar of the testing period. It includes the profit or loss on positions that are still open.
- Time runs from the first bar of the testing period to the last bar, not from the first trade. A year counts as 365.2425 days.
- Calculation: the report divides the ending equity by the initial capital, raises the result to the power of 1 ÷ years, and subtracts 1.
For example, 10,000 of initial capital that grows to 12,100 over exactly two years gives (12,100 ÷ 10,000)^(1 ÷ 2) − 1 = 0.10, so CAGR is 10%.
The card shows a dash when the initial capital or the ending equity is not positive, when the testing period covers no calendar time, or when the dataset’s timestamps cannot be used. Hold the pointer over the dash to see the reason.
On a short testing period, a small gain can become a very large yearly rate. For example, a 5% gain over 30 days gives a CAGR of about 81%. Check the length of the period before you rely on CAGR.
Why Account Size Required Is an Estimate
Suppose the engine records maximum margin use of 25,000 and maximum intrabar drawdown of 3,000. Its Account size required estimate is 25,000 + 3,000 = 28,000. The two maxima can occur at different moments. This sum describes the completed simulation; it is not a calculation of the smallest live account that could support the strategy or a reserve for future losses.
For a position worth 100,000, 4x leverage requires 25,000 of margin, while 1x requires 100,000. Lower margin requirements change the capital ratios without making the price exposure smaller. Keep leverage, position size, initial capital and costs the same when comparing two runs' capital efficiency.
Read Margin Usage
Margin is the amount the account must fund to hold a position. It is a percentage of the position's current value, set by the leverage setting: 100% at 1x leverage and 25% at 4x.
The Margin used at bar close chart plots the margin in use at each bar close. Use Scale to switch the chart between Regular, which shows amounts, and % of initial capital. The % of initial capital option is available only when the run has an initial capital above zero.
If the run has no margin value for each bar, the chart area shows Margin usage telemetry unavailable. Average margin used and Margin efficiency then show a dash.
| Report Term | How to Read It |
|---|---|
| Average margin used | The mean of the margin recorded at each bar close. Bars with no margin in use count as zero. |
| Maximum margin used | The highest margin that Studio’s simulation engine recorded at any point in the run, not only at bar close. It can differ from the highest point on the Margin used at bar close chart. |
| Margin efficiency | The report’s Net P&L divided by Average margin used, multiplied by 100. In the example below, 600 ÷ 2,000 × 100 = 30%. When the average margin used is zero, the ratio cannot be calculated and the report shows a dash. |
| Margin calls | The number of simulated margin-call events that forced a liquidation. |
| Total liquidated volume | The total value of the positions liquidated in those events, in the account currency. |
| Largest liquidated volume | The value liquidated in the largest single margin-call event, in the account currency. |
A dash is not a zero. A dash means the value could not be measured or calculated. Only a reported zero means that no events were counted. Hold the pointer over a dash on this tab to see the reason.
An Illustrated Example
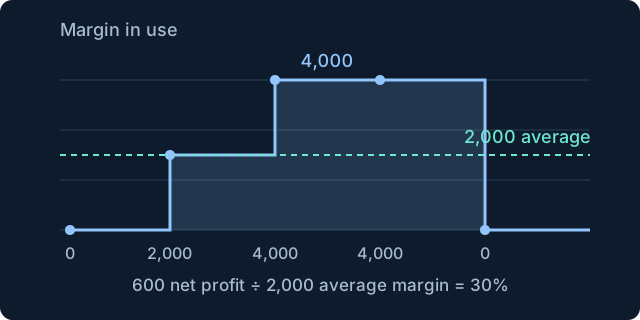
Margin use at five bar closes is 0, 2,000, 4,000, 4,000, and 0. The two zero bars count, so the average is 10,000 ÷ 5 = 2,000. With 600 in net closed profit, margin efficiency is 600 ÷ 2,000 × 100 = 30%. Original illustration using invented values. Select the image to open it at full size.
Use the Views Together
Open Margin usage first to see how much margin the run used and when. Then open More views and choose Capital efficiency to compare the result with the initial capital and with the account size required.
If margin looks unexpectedly low, check the leverage in the strategy’s Settings → Properties. Long leverage and Short leverage set how much of each position the account must fund: 1x requires 100% margin and 4x requires 25%. When Unlimited is selected for a direction, margin checks are disabled for that direction, and its positions use no margin. If a run trades only in that direction, Average margin used and Maximum margin used are zero, Margin efficiency shows a dash and Account size required equals the maximum intrabar drawdown.