Max Drawdown and Run-Ups in Pine Script Backtests
The Growth and decline view in AI Edge Studio shows how far a Pine Script® backtest's equity rose and fell, and how long each rise and fall lasted. A rise is a run-up, and a fall is a drawdown. A final profit does not tell you how far equity fell on the way there, so read these numbers next to it. These figures come from a simulation on past data. They are hypothetical and do not predict future returns. A future drawdown can be deeper or last longer than any drawdown in this test.
Find This View
- Open a strategy in Studio, select the Strategy tab, then choose Metrics.
- Under Performance analysis, select the Growth and decline tab.
- Select Overview, Run-ups or Drawdowns to see each group of measurements.
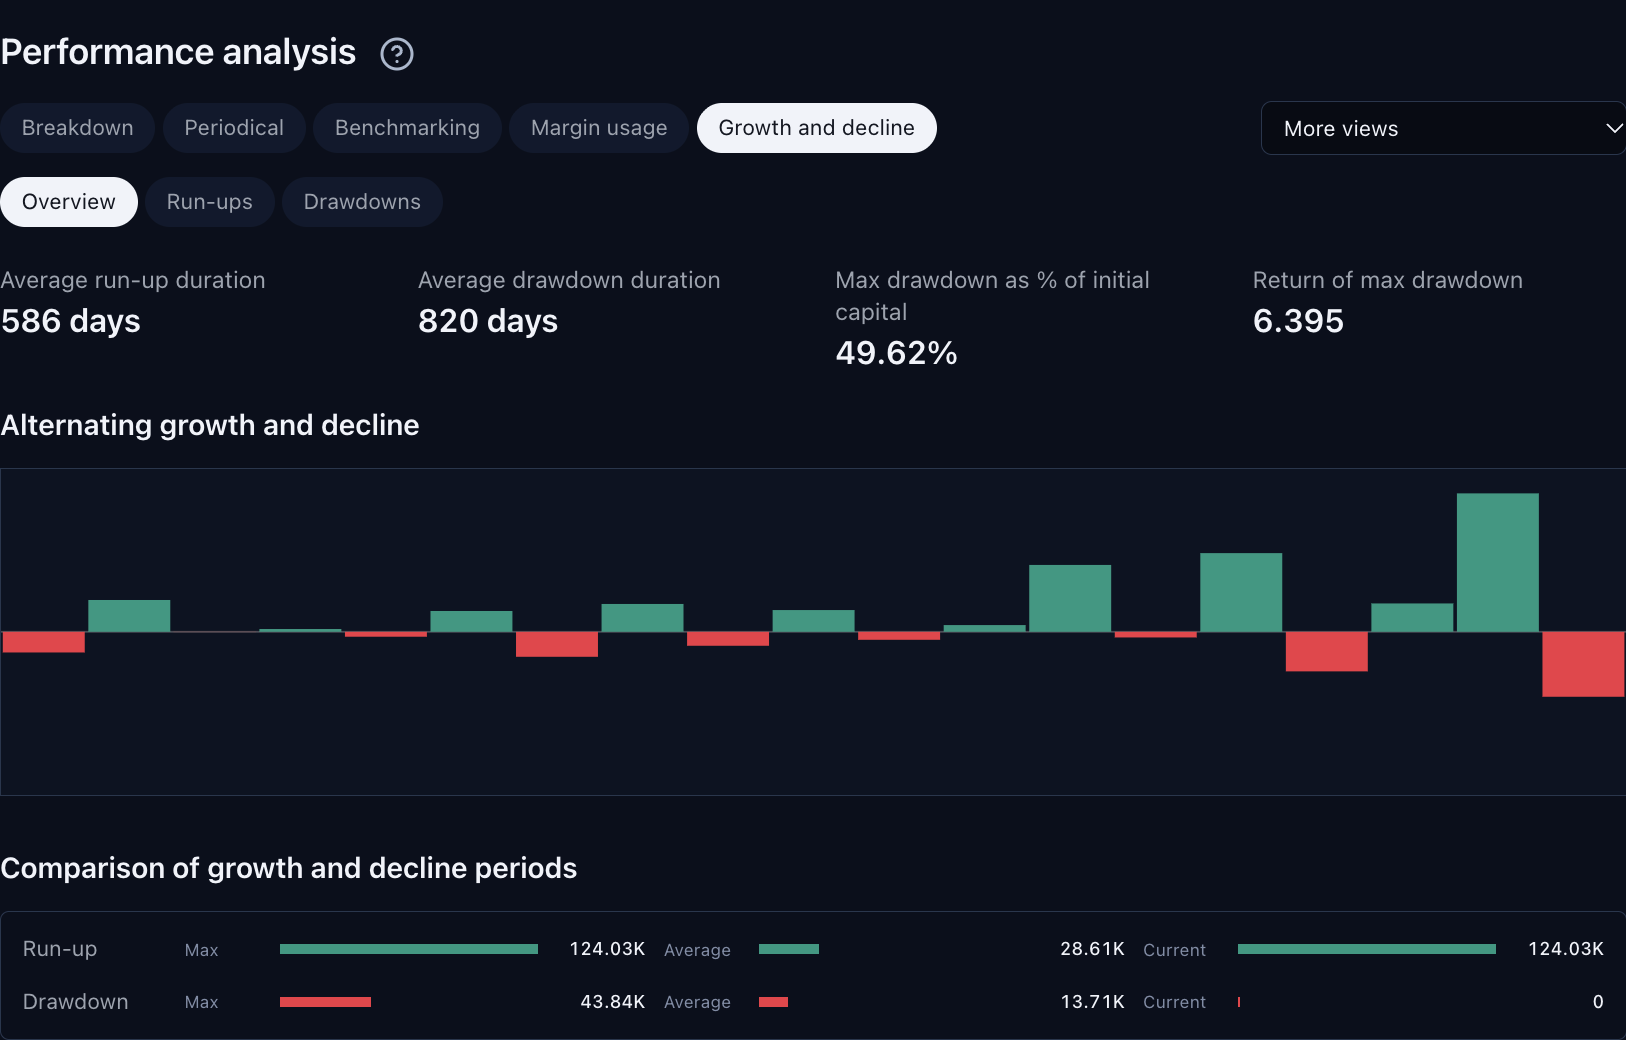
The Overview tab shows four summary numbers above two charts. Open it under Performance analysis → Growth and decline. On the Run-ups and Drawdowns tabs, most measurements carry a (close-to-close) or (intrabar) label. Both terms are explained below. Select the image to open it at full size.
This capture uses the built-in Trend Participation Filter strategy with Studio’s bundled SPY dataset. The displayed settings and results are examples. In this run, Max drawdown as % of initial capital is 49.62%, while Key stats shows the same 49,620.29 USD drawdown amount next to 13.52%. The two percentages use different bases. Compare Percentages That Use the Same Base explains why.
Before you compare two drawdown numbers, check two things:
- What the percentage is a share of: the initial capital or an equity peak. Some labels name it, and some percentages have no label. What Each Tab Shows gives the base of each one.
- How it was measured: close-to-close or intrabar. Most labels name it. Max duration has no label. It is a close-to-close value.
The sections below explain both.
Growth, Decline, and Duration
Equity is the value of the test account: the initial capital plus profit and loss. The report calls a rise in equity a run-up or growth, and a fall a drawdown or decline. A peak is the highest equity reached so far.
| Report Term | How to Read It |
|---|---|
| Run-up | A rise in equity. A run-up period starts at a low and ends at the last value before the first decline. The report shows the amount and the elapsed time of each period. |
| Drawdown | A fall from an earlier equity peak. The amount is the loss from that peak. A percentage divides that amount by a base, such as the initial capital. Compare Percentages That Use the Same Base lists the bases. |
| Duration | Elapsed calendar time, taken from the timestamps in the dataset and shown in days. A drawdown period runs from an equity peak until equity is back at that peak, so its duration includes the recovery. A run-up period ends at the first decline, so it is often shorter. Because the report measures the two differently, a long drawdown period can contain several run-ups. |
What Each Tab Shows
| Tab | What It Shows |
|---|---|
| Overview | Average run-up duration, Average drawdown duration, Max drawdown as % of initial capital and Return of max drawdown, followed by the Alternating growth and decline and Comparison of growth and decline periods charts. |
| Run-ups | Avg run-up duration (close-to-close), Avg run-up (close-to-close), Max duration, Max run-up (close-to-close), Max run-up (intrabar) and Max run-up as % of initial capital (intrabar). |
| Drawdowns | Avg drawdown duration (close-to-close), Avg drawdown (close-to-close), Max duration, Max drawdown (close-to-close), Max drawdown (intrabar), Max drawdown as % of initial capital (intrabar) and Return of max drawdown. |
The two charts on the Overview tab show the periods side by side:
- Alternating growth and decline draws one bar for each completed period: green above the line for a run-up, red below it for a drawdown.
- Comparison of growth and decline periods shows the Max, Average and Current amounts for run-ups and for drawdowns. All the amounts in this chart are close-to-close values.
Some labels do not say how a value was measured or what a percentage is a share of:
- Max duration has no method label. It is measured close to close.
- Return of max drawdown has no method label. It uses Max drawdown (intrabar).
- The small percentage under Max run-up (close-to-close) is a share of the equity the rise started from. The one under Max drawdown (close-to-close) is a share of the peak the fall started from.
Read the values with these rules:
- Drawdowns are positive amounts. A drawdown of 1,200 means equity fell by 1,200.
- Durations are rounded to whole days. A period shorter than one day shows as
<1 day. - A dash means the report could not calculate the value.
- Averages count completed periods only. A drawdown that has not recovered at the last equity observation used, or a rise still under way, is left out of the averages. It still counts toward the Max amounts and Max duration.
- Current describes the last equity observation used. With a complete, usable closed-trade path, this is the last closed trade; later bars without exits do not extend the current period or its duration. When the report uses bar-by-bar equity instead, it is the last valid bar. For a run-up, Current is the rise still under way. For a drawdown, it is the distance below the peak.
If a Chart Shows Not Enough Data to Show
The two charts on the Overview tab need at least four completed periods, counting run-ups and drawdowns together. With fewer, each chart shows Not enough data to show. The message describes the chart. It does not mean the strategy has no risk: the four numbers above the charts and the Run-ups and Drawdowns tabs still show available values; the report uses a dash when it cannot calculate one.
Why Close-to-Close and Intrabar Can Differ
The Run-ups and Drawdowns tabs label most measurements (close-to-close) or (intrabar). The two labels name two ways of measuring:
| Label | Where the Number Comes From |
|---|---|
| Close-to-close | The report rebuilds it from equity over time. With a complete, usable closed-trade path, it uses equity after each closed trade. Otherwise, including runs with no closed trades or partial trade detail, it uses available bar-by-bar equity. |
| Intrabar | The broker simulation reports it. It is the largest rise or fall the simulation recorded, including price moves inside a bar. |
An intrabar value can include a move against the position that happens inside a bar. A close-to-close value does not show that move. The two methods read equity at different moments and measure from different starting points. Compare a close-to-close number only with another close-to-close number, and an intrabar number only with another intrabar number.
Max drawdown in Key stats, at the top of Metrics, shows the maximum drawdown reported by the broker simulation when that value is available. Otherwise it shows the close-to-close maximum.
Compare Percentages That Use the Same Base
The same drawdown gives different percentages, because each one divides by a different base:
| Percentage | Divides the Drawdown Amount By | In the Example Below |
|---|---|---|
| Max drawdown as % of initial capital | The capital at the start of the test | 1,200 / 10,000 = 12% |
| A percentage of the peak | The equity peak the fall started from | 1,200 / 12,000 = 10% |
The headline Key stats → Max drawdown percentage is not that amount divided by one base. The broker simulation reports it separately. For each trade, it measures the fall against the realized-equity peak before that trade: the initial capital plus the highest closed profit reached so far, with paid entry fees counted. Key stats shows the largest of these percentages. The trade with the largest percentage is not always the trade with the largest amount, so dividing the Key stats amount by a base may not give the Key stats percentage.
For example, with 10,000 of initial capital, suppose realized equity reaches 12,000 and a later trade falls 1,200 below that peak. That trade's percentage is 1,200 / 12,000 = 10%, and the same amount is 12% of initial capital. Now suppose an earlier trade fell 1,100 from the 10,000 starting equity, which is 11%. Key stats then shows the largest amount, 1,200, next to the largest percentage, 11%, which came from the other trade. These are Strategy Report figures.
An optimizer study scored on Executed Trades ranks Maximum Drawdown by this same simulated percentage. One scored on Signal Returns measures drawdown from its per-trade signal returns. See Check What the Study Scores.
Compare two percentages only when they use the same base.
Max drawdown in Key stats and the Max drawdown as % of initial capital card on the Overview tab use the same drawdown amount, but their percentages use different bases, so they usually differ. When the broker simulation does not report its percentage, Key stats shows a dash for it. Other places show the maximum drawdown like this:
- The Comparison of growth and decline periods chart always uses the close-to-close maximum, so its Max drawdown can differ from Key stats.
- The downloaded spreadsheet gives Max drawdown as a percentage of initial capital, not the Key stats percentage.
- The summary saved for AI tools gives both:
max_drawdown_percentis the percentage of initial capital, andmax_drawdown_intrabar_percentis the Key stats percentage.
Return of max drawdown divides Total P&L by Max drawdown (intrabar). Total P&L is net profit plus open P&L, the profit or loss on positions that are still open. The result is a ratio, not a percentage or a money amount. For example, 2,400 of Total P&L against 1,200 of drawdown gives 2. When the drawdown is missing or zero, the report cannot calculate the ratio and shows a dash.
See the Same Measurements Elsewhere
The Performance Chart marks each completed run-up and drawdown as a thin green or red bar below the plot when its Run-ups and drawdowns layer is on. The layer is on by default, so you can see when each period happened.
To keep the numbers in a spreadsheet:
- Open the Strategy report menu, the ⌄ beside the strategy name.
- Choose Download data as XLSX.
The workbook's Risk & Drawdown sheet lists these measurements with their units and bases, using full names such as Maximum drawdown (close-to-close). It also holds the capital-efficiency and margin values and the margin used at each bar close. It does not list each run-up or drawdown period. The Overview sheet gives Max drawdown in the account currency and as a percentage of initial capital.
An Illustrated Example
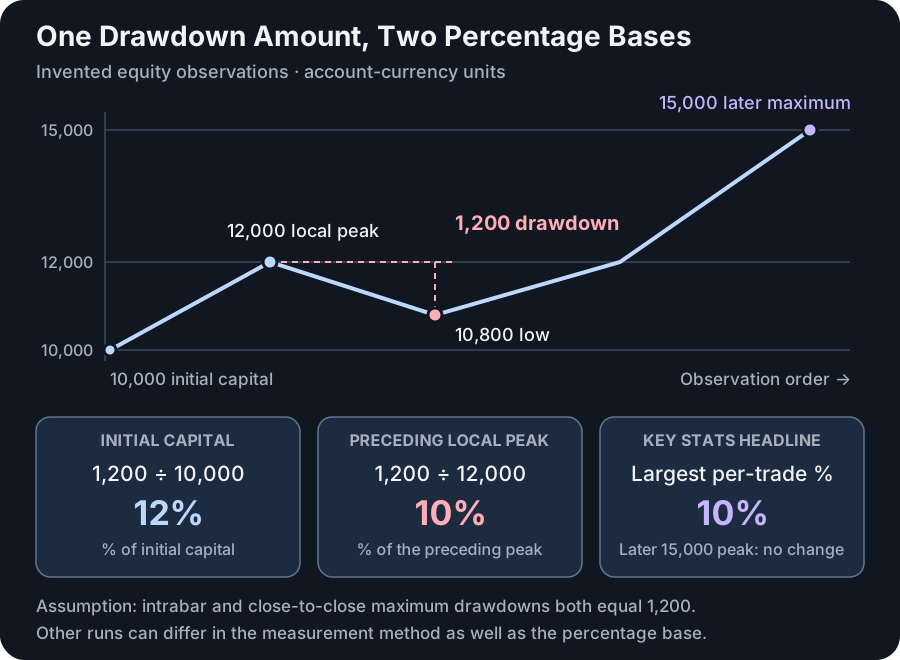
Original illustration using invented values. Equity falls from 12,000 to 10,800 and later rises to 15,000. Assume the engine also reports a maximum intrabar drawdown of 1,200 from the 12,000 realized-equity peak. The amount is then 12% of initial capital and 10% of that peak. If no other trade fell further in percentage terms, Key stats shows 1,200 and 10%. The later 15,000 peak changes neither percentage. The figure isolates the denominator difference; other runs can also differ in their intrabar and close-to-close amounts. Select the image to open it at full size.
When recording or comparing a drawdown, keep all three parts together: amount, measurement method and percentage base. For example, write “1,200 intrabar drawdown; 12% of 10,000 initial capital” rather than “12% drawdown.” This makes exports and headline cards easier to reconcile.