Performance Chart for Pine Script Backtests
The Performance chart in AI Edge Studio shows how a Pine Script® backtest's profit and loss built up, one closed trade at a time. Use it to follow the path to the final closed-trade total and to find the trades behind each change. Select a point on the chart to see that trade on the market chart. These figures come from a simulation on past data. They are hypothetical and do not predict future returns.
Find This View
- Open a strategy in Studio.
- Select the Strategy tab, then Metrics.
- Find the Performance section, below Key stats.
The Strategy tab appears after you run a strategy script.
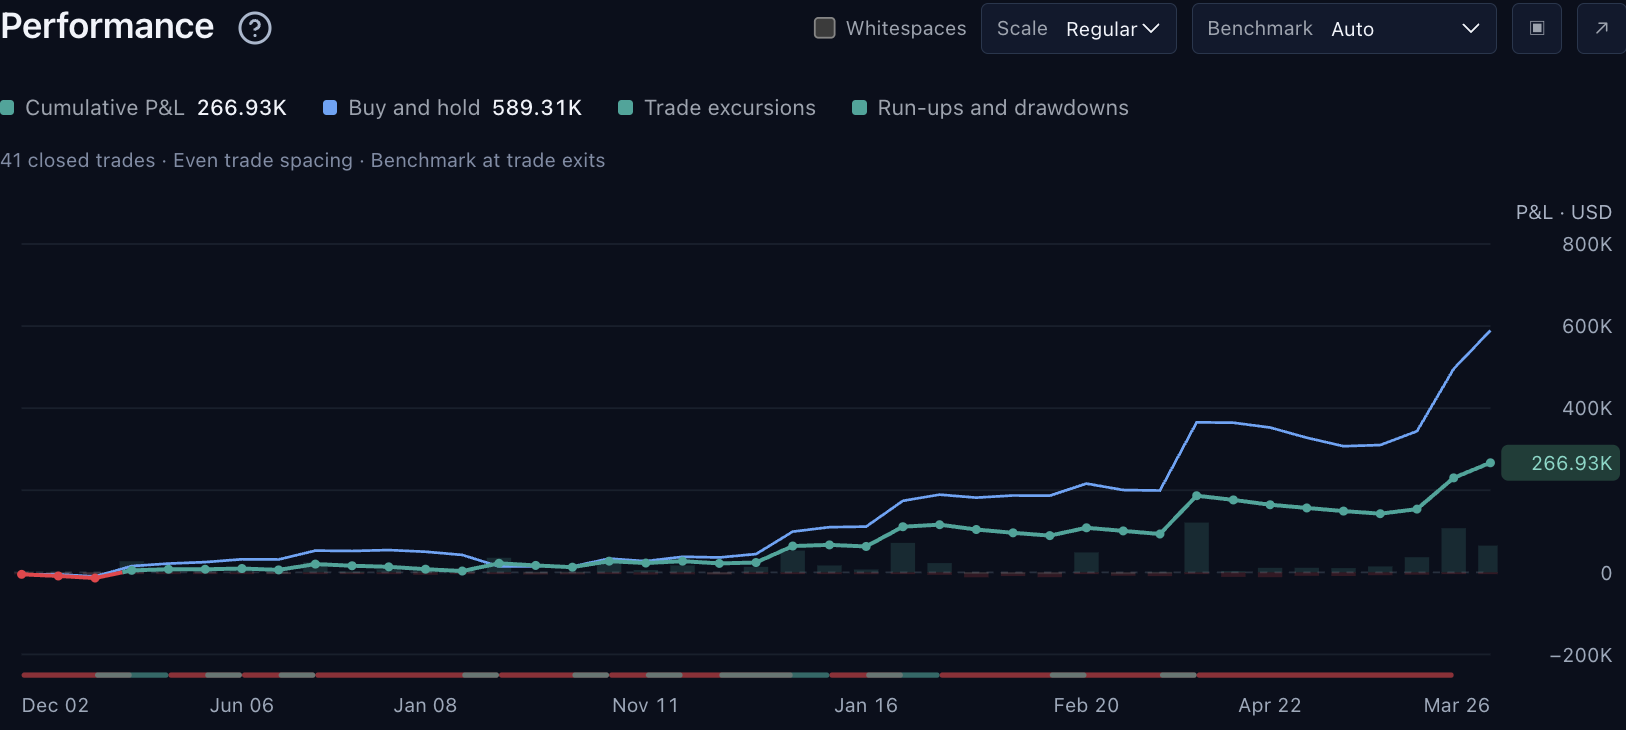
The Performance chart. The legend lists the four layers, and the controls are at the top right. The dates along the bottom use a two-digit year: Dec 02 means December 2002, and Mar 26 means March 2026. Explore It in Studio explains each control. Select the image to open it at full size.
This capture uses the built-in Trend Participation Filter strategy with Studio’s bundled SPY dataset. The displayed settings and results are examples.
A strong final total can hide a difficult stretch along the way. Start with the path, which is the shape of the line from the first closed trade to the last. Then inspect a trade in any stretch that looks difficult.
What Each Layer Tells You
The chart draws four layers. Each layer has an entry with the same name in the legend.
| Layer | How to Read It |
|---|---|
| Cumulative P&L | The running total of profit and loss from closed trades, measured from zero rather than from initial capital. Each point is a trade exit, so the first visible point already includes that trade's result; the chart does not add a starting point at zero. The line leaves out open positions, so its last value can differ from Total P&L in Key stats. It can also differ from the report’s Net P&L when that total already includes paid entry commission on positions still open; see the fee example. |
| Buy and hold | A comparison line, drawn in blue on this chart. It shows the profit from investing the same initial capital at the strategy’s first entry and holding it. The chart plots it only at trade exits. The Benchmarking cards in Return Details use the market close at the end of the report, so they can differ from the line’s last point. |
| Trade excursions | Faint bars at each trade. A green bar above the zero line shows how far the trade moved in your favor while it was open. A red bar below the zero line shows how far it moved against you. These are observations during the trade, not additional booked profit or loss. Do not add them to the trade result. |
| Run-ups and drawdowns | A thin strip below the plot. Green marks a period when equity grew (a run-up), and red marks a period when it declined (a drawdown). Hover over a segment to see its amount. Use this layer to find the stretches to inspect more closely. Equity Run-Ups and Drawdowns explains the measurements. |
In the Benchmarking chart under Performance analysis, the colors differ: buy and hold is orange, and the strategy is blue.
Explore It in Studio
The controls are in the Performance section header, at the top right of the chart.
| To Do This | Do This |
|---|---|
| Hide or show a layer | Select its name in the legend. The legend also shows the latest value of Cumulative P&L and Buy and hold. |
| Switch between account-currency values and percentages | Set Scale to Regular or Percent. Percent shows every layer as a percentage of initial capital. You can choose it only when the initial capital is above zero. |
| Space the trades by time | Select Whitespaces. See Trade Spacing. |
| Change the axis for Buy and hold | Set Benchmark to Auto, Shared axis or Separate axis. See Benchmark Axis. |
| See the details of a trade | Hover over the chart. A card shows the nearest closed trade: its number and direction (Long or Short), its exit date and time in the chart’s time zone, Cumulative P&L, Trade P&L, Favorable excursion and Adverse excursion. A detail the report does not have is left out. When the Buy and hold layer is on, the card also shows the buy-and-hold value at that exit. |
| Find a trade on the market chart | Select its point. Studio opens the Chart tab at the bar where that trade closed. To return to the report, select the Strategy tab. |
| Use the keyboard | Move focus to the chart. Press the Left Arrow or Right Arrow key to move between trades, or Home or End to go to the first or last trade. Press Enter or Space to show the trade on the market chart. Press Escape to clear the selection. |
| Get a taller chart | Select the expand button (↗). The chart gets taller. Studio hides the row of report buttons above Key stats, which includes the testing period, and the sections below the chart. Key stats and the Metrics and Trades tabs stay visible. To show the hidden parts again, select the button (↙) again. |
| Save the chart as an image | Select the Take a snapshot button (▣). Your browser downloads the chart as a PNG image named strategy-performance.png. |
Trade Spacing
By default, the chart spaces the closed trades evenly. The distance between two points then does not show how much time passed between them.
The labels along the bottom show when the labeled trades closed, in the chart’s time zone. That zone is UTC unless you choose another one in the market chart’s Time zone menu. The label format depends on how much time the plotted trades span:
- More than a year: the month and a two-digit year, so Dec 02 means December 2002.
- Less than a year: the month and day, such as Mar 5.
- Less than a day: the time of day.
When some trades have no usable date, the labels show bar numbers instead. Why Exported Dates Can Differ explains how the time zones of the report’s views differ.
To see the time between trades, select Whitespaces. The chart then spaces the trades by elapsed time, so a long period with no closed trade becomes visible.
The note under the legend shows how many closed trades the chart plots and which spacing it uses:
- Even trade spacing: Whitespaces is off.
- Calendar spacing: Whitespaces is on.
- Bar spacing · incomplete timestamps: Whitespaces is on, but some trades have no usable date. The chart spaces the trades by bar number instead.
The note can also contain these words:
- retained, as in 41 retained closed trades: the report keeps the detail of only part of the run’s trades. See When Trade History Is Incomplete.
- available, as in 40 available closed trades: some closed trades could not be placed on the line.
- Benchmark at trade exits: the buy-and-hold line has a value at every plotted exit. Benchmark at 40 of 42 trade exits means that it has no value at two of them.
- Buy and hold uses its own labelled left axis: see Benchmark Axis.
Benchmark Axis
The Benchmark menu controls the scale for the Buy and hold line.
- Auto (the default) normally keeps both lines on one axis. It moves Buy and hold to its own axis on the left when the buy-and-hold range is more than four times the range of the strategy layers that are shown (Cumulative P&L and Trade excursions). Each range is measured from zero.
- Shared axis always uses one scale for both lines.
- Separate axis gives Buy and hold its own axis on the left. For this, Buy and hold and at least one of Cumulative P&L and Trade excursions must be shown and have values to plot.
When Buy and hold has its own axis, the legend marks it left axis, and the note under the legend says so. Read each line against its own axis. The heights of the two lines are then not comparable.
Reconcile the Last Point With Key Stats
Suppose a run starts with 10,000, closes trades for a net profit of 600, and ends with another 100 of open profit. With complete trade detail, the last Cumulative P&L point is 600, while Key stats → Total P&L is 700. Ending account equity is 10,700. The chart plots closed profit, not the account balance.
If the values still do not reconcile, check that both views describe the same testing period and that no stale result or Partial trade detail notice is present. For the benchmark, also check its endpoint and whether it uses a separate axis. Return Details explains the closed and open components.
When Trade History Is Incomplete
A Partial trade detail notice appears below the chart when the report did not keep every individual trade. Studio keeps a closed trade’s detail only while its entry and exit orders are among the run’s latest 9,000 filled orders, so a long run with many orders loses the detail of its earliest trades. The notice says how many closed trades were kept, and the note under the legend counts retained closed trades. Why Trade Detail Can Be Partial explains more.
The chart can still show the totals it knows and the groups of trades it kept, without every trade in between. Where the line has a gap, the report does not know the profit and loss of the trades in between. A gap is a limit of the data, not evidence that the strategy was flat.
The Buy and hold comparison can also be unavailable. Its legend entry is then dimmed. Hover over the entry to read the reason.
If the testing period has no closed trades, the chart shows No closed trades in this testing period. If it has closed trades but cannot place their profit and loss on the line, it shows Closed-trade P&L is unavailable for the retained history.
An Illustrated Example
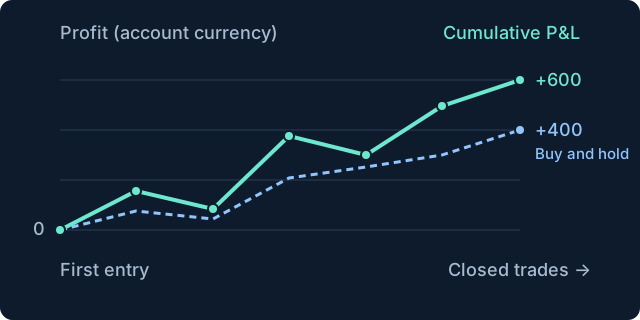
Original illustration using invented values to explain the concept. Cumulative P&L finishes at 600 and Buy and hold at 400, after different paths. Both lines start at zero at the first entry to show where the totals are measured from. In Studio, the chart does not add this starting point. Its first point is the exit of the first trade it plots. Select the image to open it at full size.
Continue Exploring
- Return Details: closed profit, open positions and the buy-and-hold comparison.
- List of Trades: the entry, exit, costs and return of each closed-trade record.
- Equity Run-Ups and Drawdowns: growth, decline, their duration and the drawdown measurements.
- All Strategy Report Guides