Trades Analysis: Win Rate, Profit Factor and Outliers
Trades analysis in AI Edge Studio shows how a Pine Script® backtest's profit or loss is spread across its individual trades. Read the averages, the two distributions and the largest trades together to see which trades produce most of the result. These figures come from a simulation on past data. They are hypothetical and do not predict future returns.
Find This View
- Open a strategy in Studio.
- Select the Strategy tab, then choose Metrics.
- Scroll to Trades analysis.
In the default layout, the Strategy tab is in the panel beside the editor. In a narrow window, that panel is below the editor.
The section has four tabs:
| Tab | What It Shows |
|---|---|
| Distribution | Four summary cards and two charts, Returns distribution and Trade distribution. |
| Streaks | Runs of consecutive winning or losing trades. |
| Time patterns | Results grouped by the hour, day of the week, or month of entry. |
| Details | A table that compares All, Long, and Short trades. |
Start with Distribution, then select Details for the table.
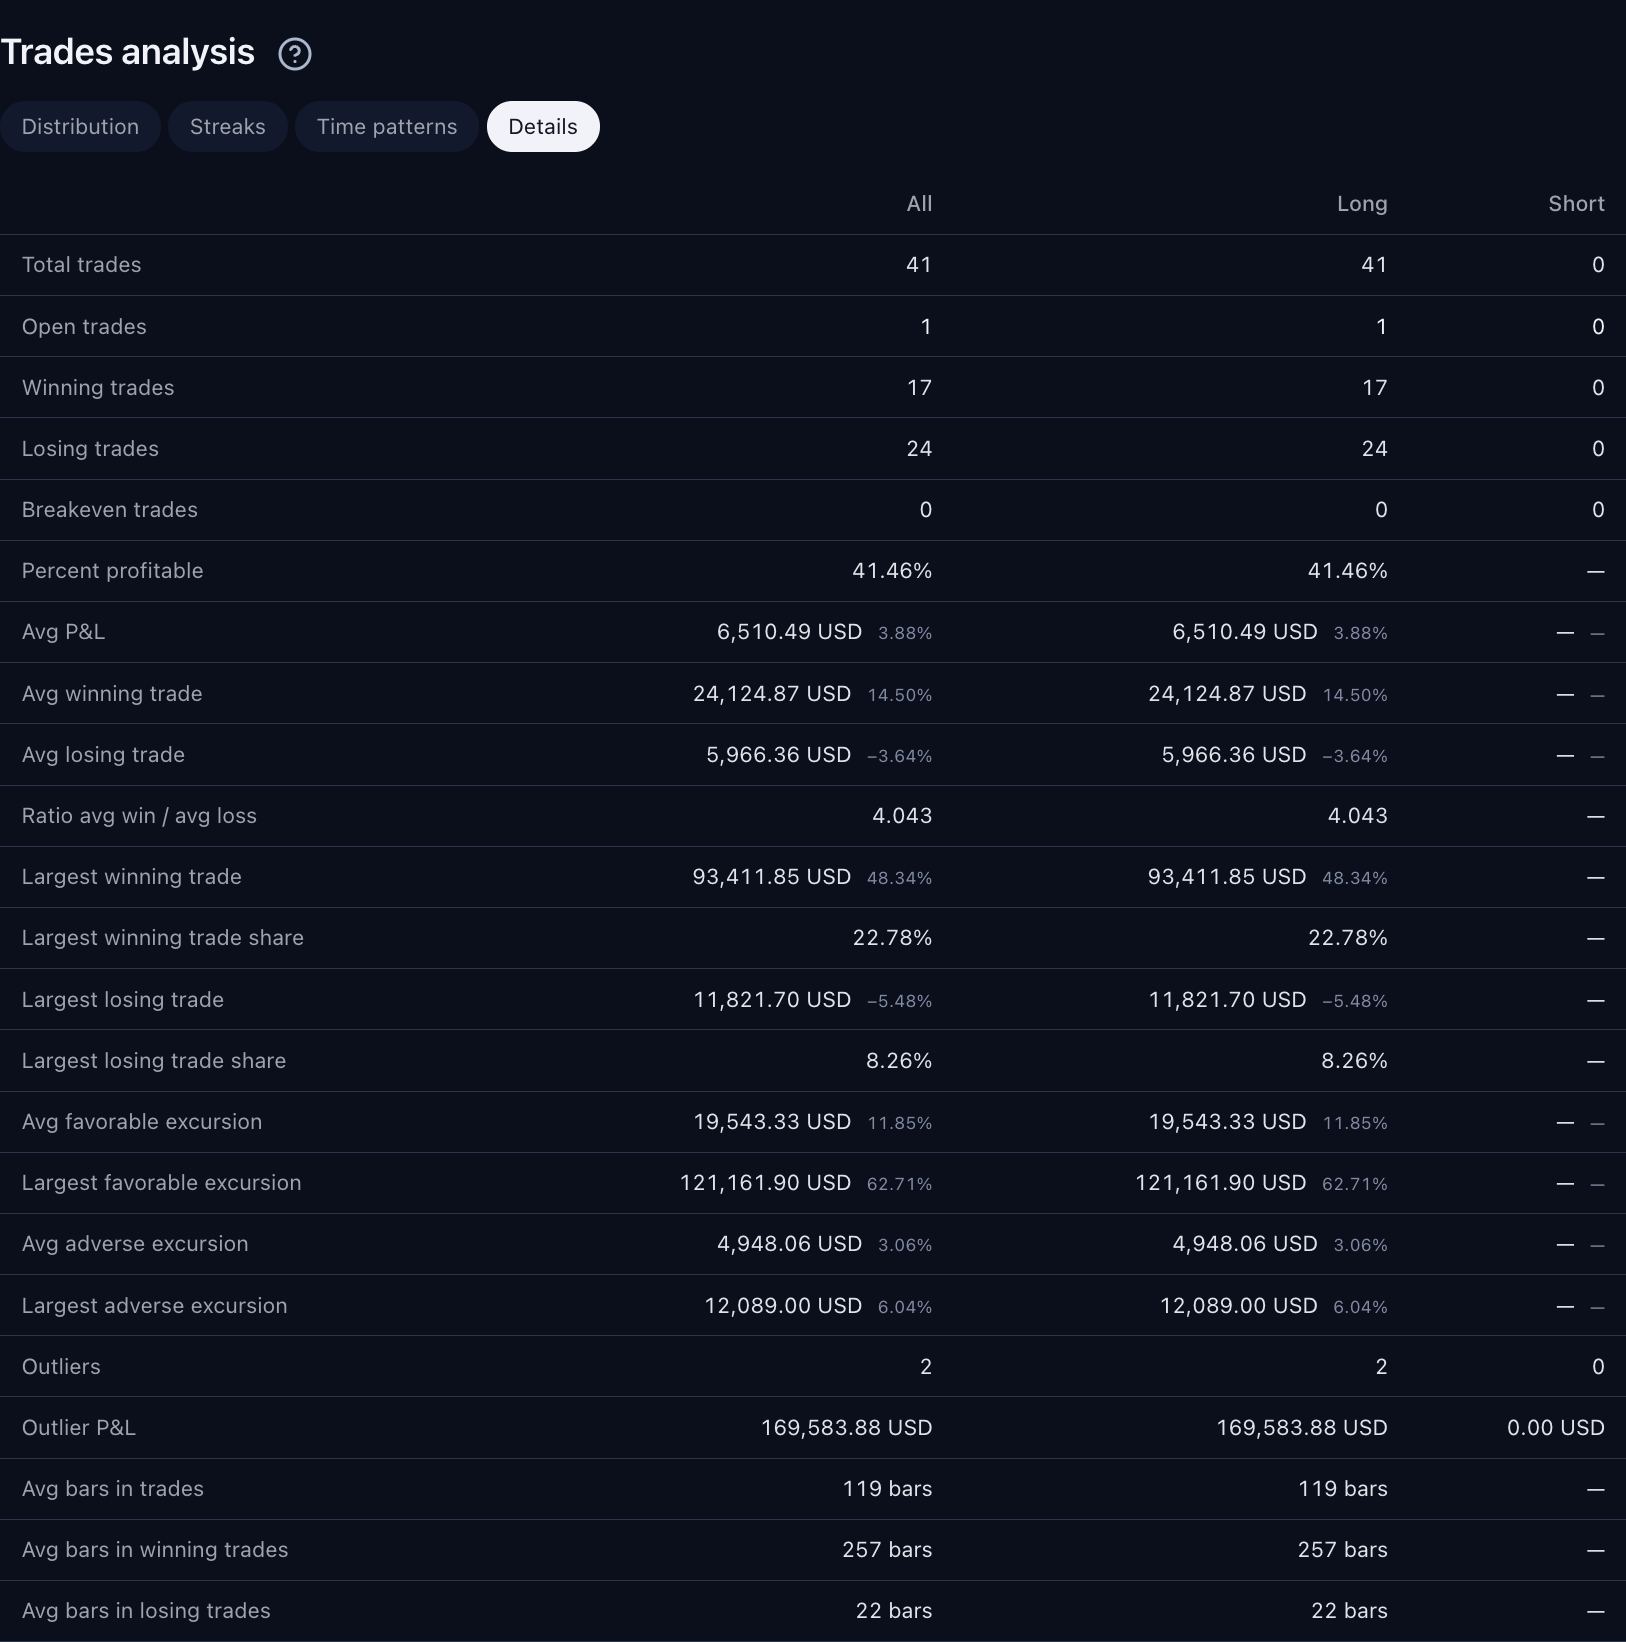
The Details table compares trade counts with the average and largest results. Lower in the table are the excursions, the outliers and the average number of bars in trades. The two charts are on the Distribution tab. Select the image to open it at full size.
This capture uses the built-in Trend Participation Filter strategy with Studio’s bundled SPY dataset. The displayed settings and results are examples.
A strategy can win most of its trades and still lose money, because a few large losses can cancel many small wins. Read how often trades win (Percent profitable) together with how much the winning and losing trades gain or lose.
Read the Charts and Cards
The Distribution tab shows four summary cards above two charts.
Returns Distribution
Returns distribution is a histogram: a bar chart of how many closed trades fall in each range of percentage return.
- A trade’s return is its profit or loss as a percentage of the position’s value at entry (the entry notional).
- Red bars (Losers) cover negative returns, and green bars (Winners) cover positive returns. A gray bar covers a range that includes zero.
- The dashed lines mark Average loss and Average profit. These two averages leave out outliers, so they can differ from the percentages beside Avg losing trade and Avg winning trade on the Details tab.
- Hover over a bar to see its return range and trade count.
The chart shows the returns of individual trades, not the daily returns of the account.
Trade Distribution and Summary Cards
| Report Term | How to Read It |
|---|---|
| Trade distribution | The donut sorts every closed trade into one of three groups: Winners, Losers, and Breakevens. Total trades sits in its center. The legend lists how many trades fall in each group and what share of all trades that is. The counts say nothing about how large each result was, so check them against the sizes of the wins and losses. |
| Average P&L | The amount is the report’s Net P&L divided by the closed-trade count; paid entry commission on positions still open can reduce it. The percentage beside it is the mean of the individual closed-trade returns. These can differ because of open-position entry fees or different position sizes. Read the fee example. |
| Average bars in trades | The average time a trade stays open, counted in chart bars. The count includes both the entry bar and the exit bar, so it is 1 higher than the average Duration of the same trades in the List of Trades. The same number means a different holding period on a different timeframe: 20 five-minute bars cover less time than 20 daily bars. |
| Largest profit and Largest loss | The largest single winning trade and the largest single losing trade, for all trades combined. Largest loss shows the amount lost without a minus sign. |
Check Win Rate Against Payoff
Suppose ten closed trades have net results of nine wins of 10 each and one loss of 120, all in the same account currency. The win rate is 90%, but gross profit is 90, gross loss is 120, and Net P&L is −30. Profit factor is 90 ÷ 120 = 0.75, and average P&L is −30 ÷ 10 = −3 per trade.
The high win rate does not cancel the larger loss. Use Details to compare average winning and losing amounts, then inspect the extreme trades. These invented results are already after costs, so commission is not subtracted a second time.
Read the Streaks
On the Streaks tab, each bar stands for an unbroken run of closed trades that all won or all lost. The bars follow the order in which the runs happened. A run stops at any of these:
- a breakeven trade
- a trade with no usable profit or loss
- a gap in the trade numbers, where a trade is missing from the sequence
Use the controls and labels like this:
- Use Direction to choose All trades, Long, or Short. The tab counts runs among the trades in the selected direction only.
- Use Measure to size the bars by Trade count or by Net P&L.
- The label under each bar gives the trade numbers in that run, as in the List of Trades. When trade numbers are unavailable, the labels read Run 1, Run 2 and so on. The List of Trades then numbers its rows Retained 1, Retained 2 and so on.
Check both measures. A long losing run with a small total loss is a different risk from a short run with a large total loss.
Read the Time Patterns
The Time patterns tab sorts closed trades into groups by when each trade was entered. It starts with Hour and All trades selected.
- Under Group entries by, choose Hour, Day of week, or Month.
- Use Direction to choose All trades, Long, or Short.
- Each row shows Net P&L, Trades, Win rate, and Commission for one group.
- The summary above the table names the group with the highest win rate and shows its number of trades. If no closed trade has a usable date, the summary shows No dated closed trades.
- The line above the summary ends with the time zone used for the grouping. If some trades have no usable profit or date, the line also says how many were left out.
The groups use the chart’s time zone, which is UTC unless you change it. The List of trades uses the symbol’s own time zone, so an hour or a day here can differ from the one shown there. For example, an entry at 09:30 on a market that trades at UTC-4 falls in the 13:00 group. Why Exported Dates Can Differ explains the difference.
Check the number of trades before you rely on a group. A high win rate from a few trades is weak evidence.
Check Whether a Few Trades Produce Most of the Result
Open the Details tab and compare the All, Long, and Short columns. The table’s rows fall into six groups:
| Rows | How to Read Them |
|---|---|
| Total trades, Open trades, Winning trades, Losing trades, Breakeven trades, Percent profitable | The counts. Total trades counts closed trades. Open trades counts trades still open at the end of the testing period, which the other rows leave out. Percent profitable is winning trades as a percentage of closed trades. |
| Avg P&L, Avg winning trade, Avg losing trade, Ratio avg win / avg loss | The average result per closed trade, per winning trade and per losing trade. The ratio divides the average winning amount by the average losing amount. A value above 1 means the average gain is larger than the average loss. |
| Largest winning trade, Largest winning trade share, Largest losing trade, Largest losing trade share | The two extreme results. Largest winning trade share is the largest winning trade as a percentage of gross profit. Largest losing trade share is the largest losing trade as a percentage of gross loss. |
| Avg favorable excursion, Largest favorable excursion, Avg adverse excursion, Largest adverse excursion | How far trades moved in your favor (favorable) and against you (adverse) while they were open. The percentages use each trade's entry notional. These are observations during a trade, not additional booked profit or loss. Do not add them to its result. |
| Outliers, Outlier P&L | Trades with unusually large results, and their combined profit and loss. See the explanation below. |
| Avg bars in trades, Avg bars in winning trades, Avg bars in losing trades | How long trades stayed open, in chart bars. Each count includes both the entry bar and the exit bar. |
If Largest winning trade share is high, much of the gross profit came from one trade. Find that trade in the List of Trades and look at when and why it happened.
For Largest favorable excursion and Largest adverse excursion, the largest amount and the largest percentage are selected independently. They can come from different trades when position sizes differ. Use the individual trade rows to connect an excursion amount with its own entry value.
The table shows loss amounts without a minus sign. For Avg losing trade and Largest losing trade, the amount is the size of the loss, and the percentage beside it stays negative. A dash means the report could not calculate the value. If Open trades shows a dash, hold the pointer over it to see the reason.
The Outliers row counts trades whose result is unusually far from the average. The report measures the spread of trade results with standard deviation: a larger standard deviation means the results are more spread out. A trade is an outlier when its profit or loss is more than three standard deviations above or below the average profit or loss per trade. For example, with an average result of 20 per trade and a standard deviation of 10, results below −10 or above 50 are outliers.
The calculation uses amounts in the account currency and the population standard deviation. This is a descriptive flag, not a verdict that a trade is wrong. The Outlier P&L row adds up the profit and loss of those trades.
Check Which Trades the Report Includes
Some parts of the report may not include every trade, for two reasons:
- No entry value. A percentage return needs the position’s value at entry. The histogram and the average percentage returns leave out a trade that has no usable entry value. That trade still counts in the trade totals and in the money amounts.
- Partial trade detail. Studio keeps a closed trade’s detail only while its entry and exit orders are among the run’s latest 9,000 filled orders, so a long run with many orders loses the detail of its earliest trades. For such a run, the histogram, Streaks, and Time patterns describe only the trades that were kept. The summary cards, the donut, and the Details table show full-period figures where the simulation supplies them. Their other figures come from the kept trades only.
To see whether your run has partial detail, look for the Partial trade detail notice. On Metrics, it is below the Performance chart, above Performance analysis. On Trades, it is above the table. It states how many closed trades were kept. These labels mark the same thing:
- retained detail beside Returns distribution
- partial detail under a column name on the Details tab
- Retained trade detail only in the line above the Streaks and Time patterns views
Why Trade Detail Can Be Partial explains more.
An Illustrated Example
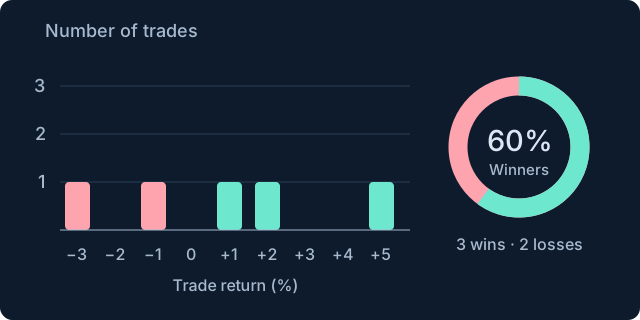
Two losing trades return −3% and −1%. Three winning trades return +1%, +2%, and +5%. The win rate is 60%, but that alone does not describe the size of the gains and losses. Original illustration using invented values to explain the concept. Select the image to open it at full size.
Continue Exploring
- List of Trades: the entry, exit, costs, and return of an individual closed-trade record.
- Return Details: closed profit, open positions, the buy-and-hold comparison, and monthly risk ratios.
- Equity Run-Ups and Drawdowns: growth, decline, their duration, and the different drawdown measurements.
- All Strategy Report Guides